Headcount Analysis Snapshots
There are two headcount analysis snapshots: hires and turnovers, and gender. These snapshots allow you to analyze quarterly headcount trends.
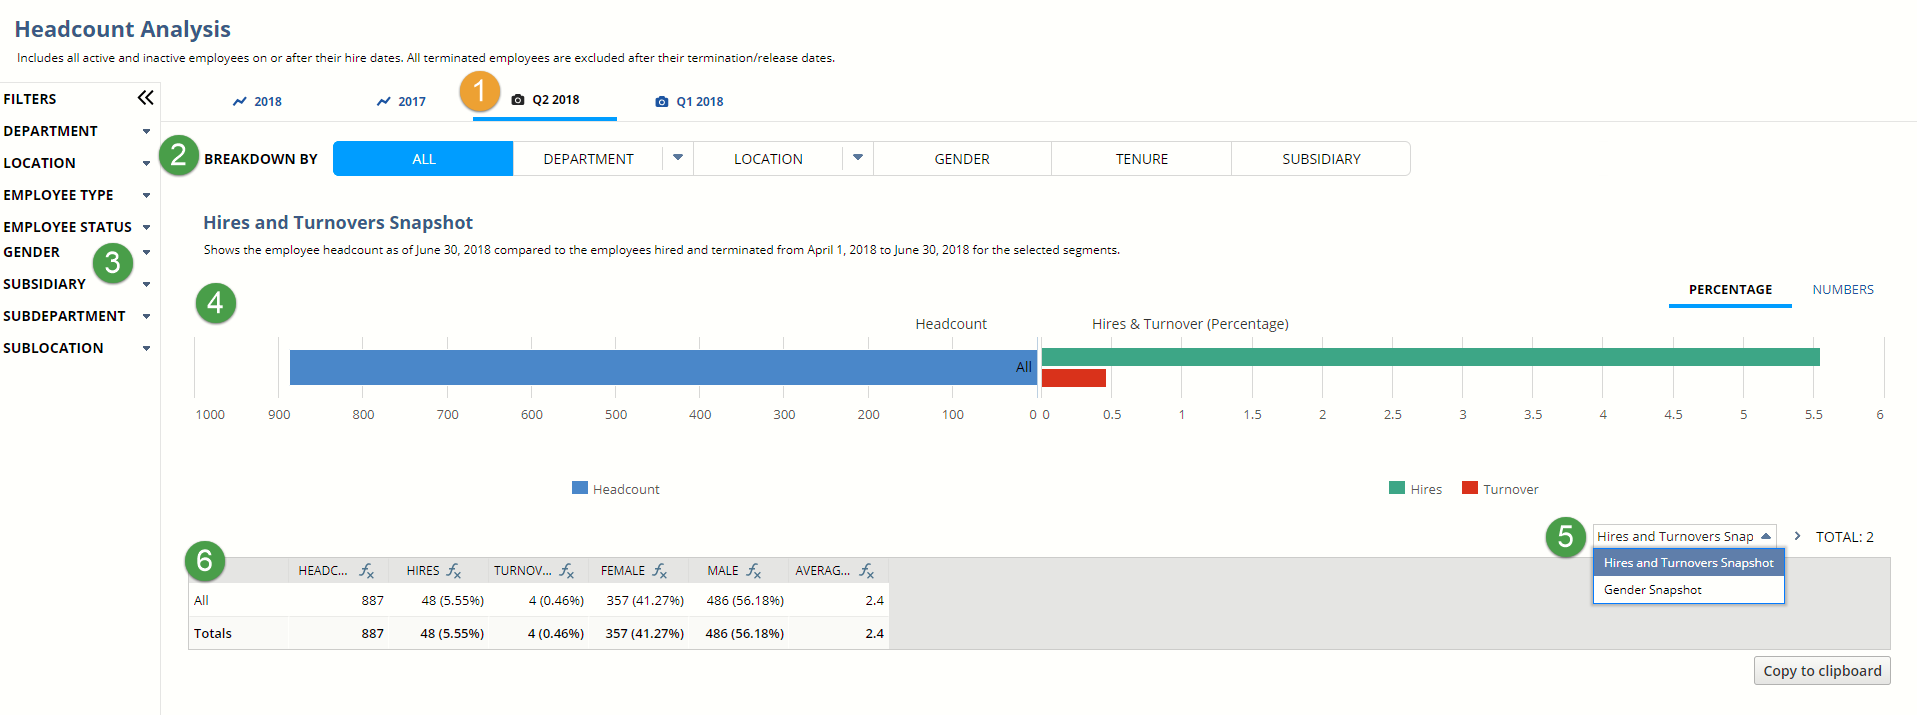
To access the headcount analysis snapshots, go to Reports > Employees/HR > Headcount Analysis. At the top of the page, click the quarter that you want to view.
Each quarter represents a completed quarter, and not a quarter-to-date.
|
1 |
Select the quarter that you want to view. |
|
2 |
Segment data by department, location, gender, tenure, or (with NetSuite OneWorld) subsidiary. You can also break down department and location by subdepartment and sublocation if needed.
Note:
When you segment by tenure, an employee's tenure starts on the Hire Date. |
|
3 |
Choose how you want to filter the data. |
|
4 |
The Hires and Turnovers Snapshot lets you compare the hiring and turnover rates across different segments in your company. The left side shows the employee headcount as of the last day in the period for the selected segments. The right side shows how many employees were hired and terminated during the period for the selected segments. |
|
5 |
Switch between the different snapshots. |
|
6 |
This table shows the data from the snapshots. To copy and paste the data into other analysis tools, click Copy to Clipboard. |
|
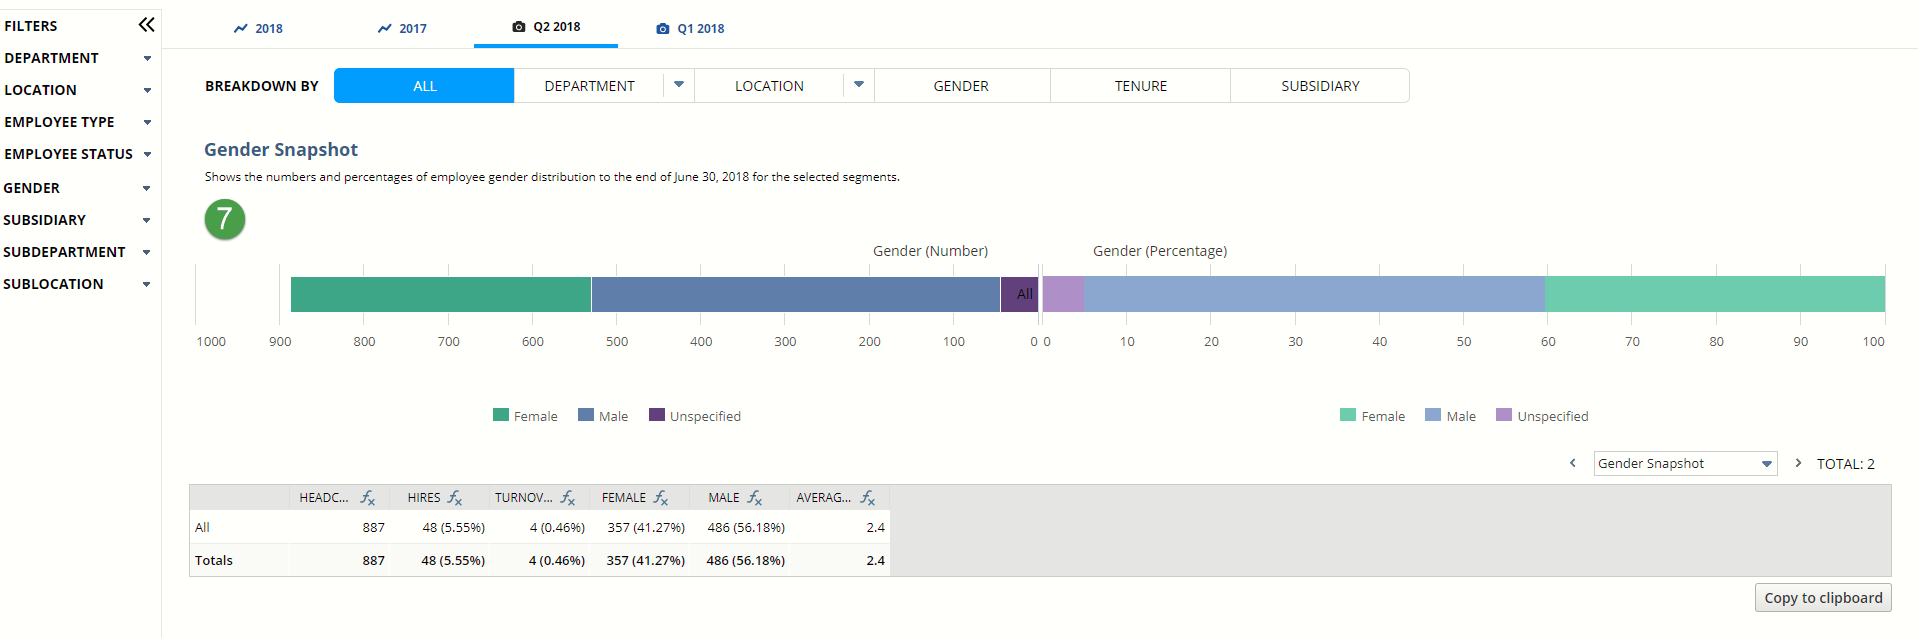
7 |
The Gender Snapshot shows the numbers and percentages of each gender as of the last day in the period for selected segments. The left side shows total headcount, and the right side shows male and female headcount percentages. |