Viewing Saved Search Details
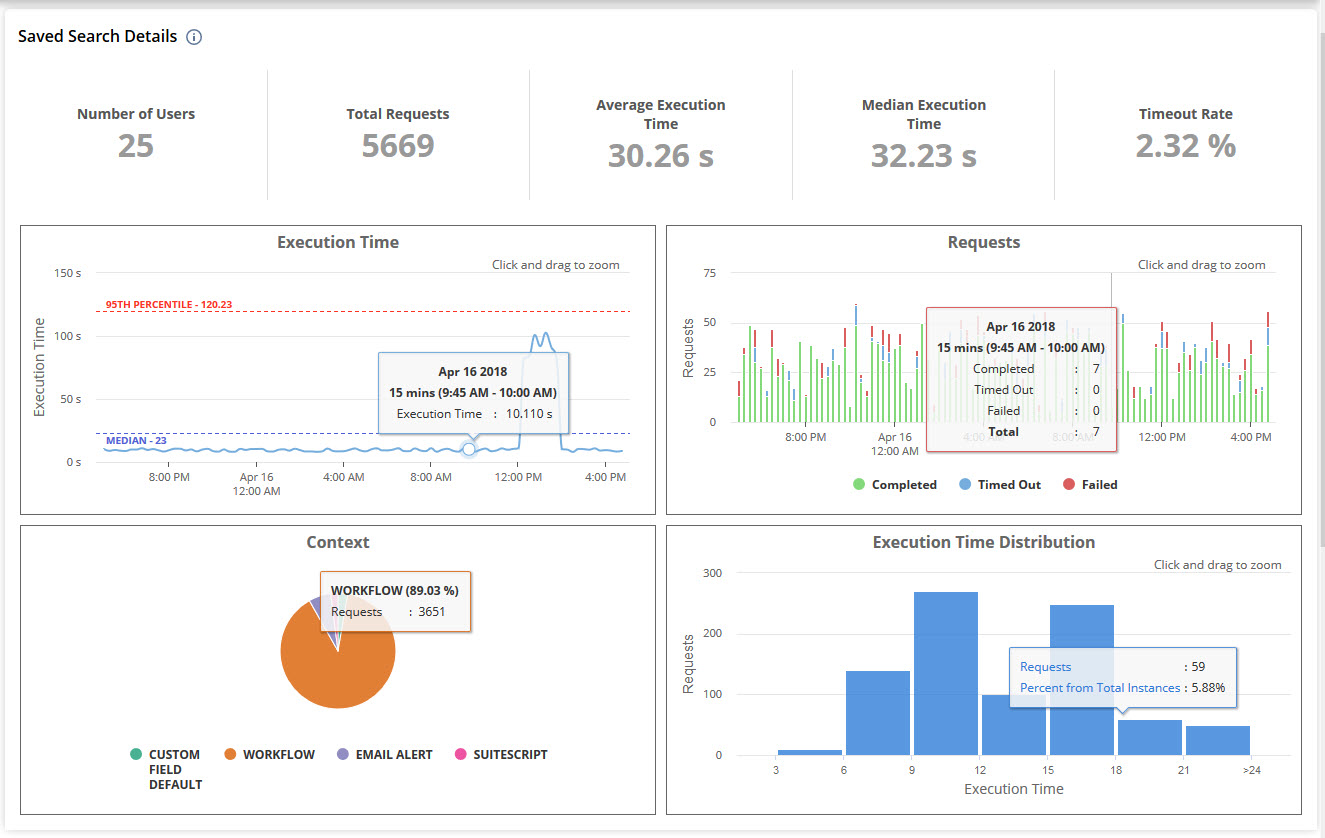
The Saved Search Details portlet shows summary lists and four charts with detailed performance stats. You'll find these charts on the portlet:
-
Execution Time - A line graph of median execution time for saved searches over a set period. This time only counts the search retrieval-not filters, fields, or the UI.
-
Requests - A combined bar and line chart that overlays timeout counts with success or failure statuses over time.
-
Context - A pie chart that shows how often different contexts used the saved search during the period.
-
Histogram - A chart comparing the number of saved searches in different execution time ranges.
Hover over any chart value to see a quick summary of related data.
Viewing Saved Search Logs
Click any chart value to view logs for that saved search.
The saved search logs only include runs that took long enough to help you troubleshoot issues. Saved Search Details doesn't track every operation or record your account processed.
The logs show the date, user, context, execution time, success, and timeout. Click the icon in the Profiler Details column to see more details.