Using the Saved Searches Portlet
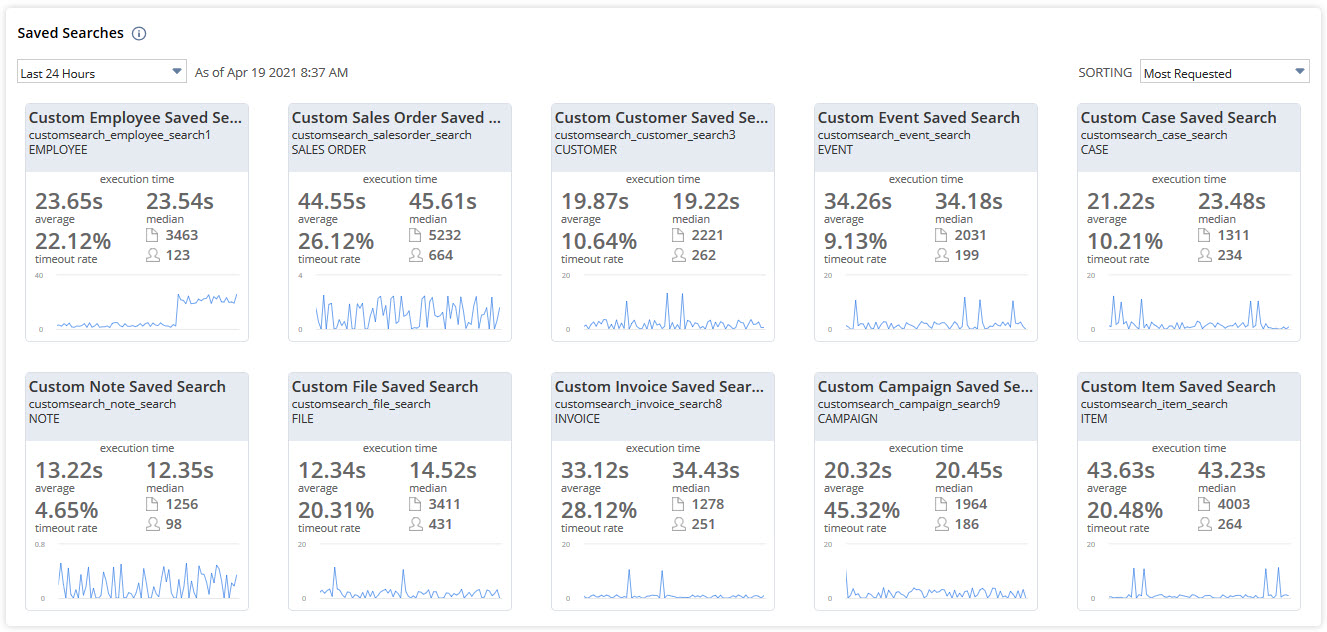
Saved searches show up as tiles.The portlet shows the top ten saved searches based on your filters. Each tile shows:
-
Execution Time - The median number of seconds it took for the saved search to run during the selected time. This time counts the search itself only, not filters, fields, or the UI.
-
Timeout Rate - The percentage of saved search executions that timed out during the period.
-
Number of Users
 - The total number of users who accessed the saved search during the period.
 -
Number of Requests
 - The total number of requests for the saved search during the period.
 -
Execution Time Line Graph - A line graph that shows median execution time for the selected period.
You can change the time range for the data using the dropdown at the top left of the page. You can pick from the following options:
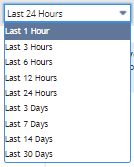
If you want info for a custom time frame, click the saved search tile. You'll go to the Search Performance Details Dashboard, where you can filter data by start and end date/time. To learn more, read Filtering Data on the Search Performance Details Dashboard.
You can also sort the data by most requested, most timeouts, most users, or highest execution time. To sort, pick an option from the dropdown at the top right of the page.