Sales Page
The Sales page shows transactions related to an item's sales order activities.
You can go to this page by going to Reports > Item 360 > Item 360, and then clicking on the Sales page.
Open Sales Orders
The Open Sales Orders portlet displays open sales orders for the item that have not been fully shipped. Click the hyperlink in the SO# column to go to the corresponding sales order record.
Open Quotes
The Open Quotes portlet shows all quotes for the item that aren't closed. Click the hyperlink in the QUOTE# column to go to the corresponding quotes order record.
Return Material Authorizations
The Return Material Authorizations portlet displays all returns made by customers for the item where the payment refund is partially completed, material is partially received or not received. Click the hyperlink in the RMA# column to go to the corresponding return authorization transaction.
Open Opportunities
The Open Opportunities portlet displays the opportunities for the item that are not closed lost or closed won or lost customer. Click the hyperlink in the Opportunity# column to go to the corresponding opportunity transaction record.
Item Demand Plans
The Item Demand Plans portlet displays the expected weekly demand plans for the item based on the previous or projected demand. The projection method can be based on linear regression, moving average, or sales forecast. Click the hyperlink in the Demand Plan# column to go to the corresponding item demand plan.
-
The Demand Date column only displays a date that is greater than or equal to the current date.
-
The Item Demand Plans portlet is displayed only when the replenishment method for the item is set as 'Time- Phased'.
Analytics
The Analytics sub page provides charts:
-
Gross Sales & Volume
-
Net Sales & Volume
-
Kit Sales
The charts display the total sales or quantity of items sold for the period you select in the filter. By default, the period selected is Last 24 months.
The charts can show sales data for up to 36 months. You also can only choose to view the charts for the required years. For instance, to hide data for a particular year, click on the year to disable. You can click on the year again to undo the action.
For example,
-
In Feb 2023, the chart includes Jan, 2021 to Feb, 2023 - 26 months, effectively including all of 2021 and 2022 plus Jan and Feb 2023.
-
In Dec 2023, the chart includes Jan, 2021 to Dec, 2023 - 36 months, effectively including of 2021, 2022 and 2023.
Invoices, cash sales and credit memos transaction types are considered for all chart types.
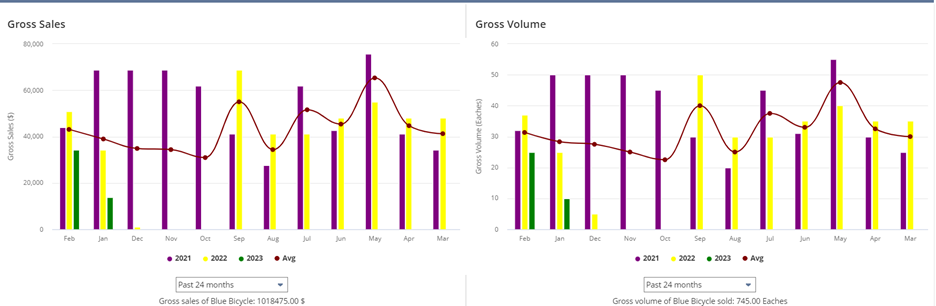
Gross Sales & Volume
The Gross Sales & Volume charts provide the gross sales and gross volume for the item along with the average gross sales trends and volume. The charts are displayed based on the base unit of measure of the item. You must select a subsidiary for the data to display gross sales in the chart.
Net Sales & Volume
The Net Sales & Volume charts provide the net sales and net volume for the item. These charts also provide a trend of the average net sales and volume. The charts are displayed based on the base unit of measure of the item. You must select a subsidiary for the data to display net sales in the chart.
-
The Gross Sales & Volume chart is calculated based on the transactions from Invoice and Cash Sales.
-
Gross Sales = Invoice amounts + Cash Sales Amounts
-
Gross Volume = Invoice Quantity + Cash Sales Quantity
-
-
The Net Sales & Volume chart is calculated based on the transactions from Invoice, Cash Sales and Credit Memos.
-
Net Sales = Invoice amounts + Cash Sales amounts - Credit Memos amounts
-
Net Volume = Invoice quantity+ Cash Sales quantity - Credit Memos quantity
-
Kit Sales
The Kit Sales charts provide a trend of sales within kits and sales by kit for the applicable item types as shown in the note below.
Inventory, assembly, and kit/package are item types applicable for Kit Sales charts.
The Sales within Kits chart gives a representation of the sales of component item associated with the kit item. The Sales by Kit chart gives a representation of the sales of total quantities of the component item being sold across multiple kits.