View the Analytics Dashboard
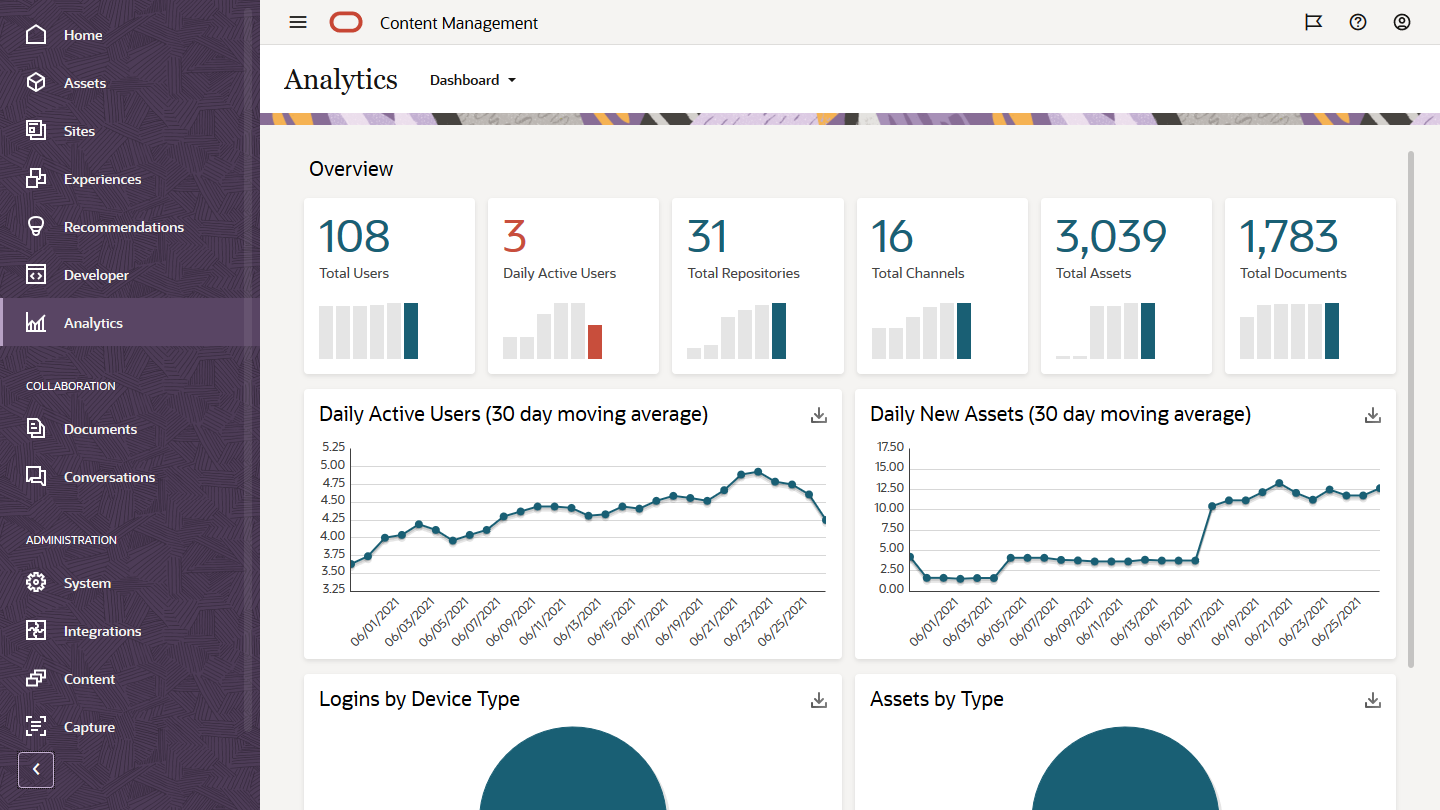
The Analytics dashboard lets you see usage, utilization, and traffic analytics for your users, repositories, channels, assets, and documents.
To view the Analytics dashboard:
- After you sign in to the Oracle Content Management web application as an administrator, click Analytics in the navigation menu.
- In the Analytics menu, choose Dashboard.

Description of the illustration analytics_dashboard.png
The Dashboard page shows an overview of important usage statistics.
| Statistic | Description |
|---|---|
| Overview | The Overview table shows the following metrics:
|
| Daily Active Users | The line graph indicates a 30-day moving average of the number of active users on the system. Active users are those who have signed in to Oracle Content Management using any client/device type (such as the browser, the desktop app, or a mobile device). |
| Daily New Assets | The line graph indicates a 30-day moving average of the number of new assets that were added. |
| Logins by Device Type | The pie chart indicates logins by device type, based on the total number of logins to Oracle Content Management. The Java API "device" represents programmatic logins. |
| Assets by Type | The pie chart indicates the percentage of assets by type, based on the total number of assets in Oracle Content Management. |
| Most Used Assets | This table lists the assets used most in your system. Each asset includes the asset name (which you can click to view the asset if you have access to it), the number of channels associated with the asset, the number of channels the asset has been published to, the number of contributors assigned to the asset, the repository that stores the asset, and the asset type used by the asset. |
For more information on the analytics data and the features available in the charts, graphs, and reports, see Understand Analytics. For example, you can download a CSV file containing the data being displayed by clicking ![]() .
.