Visualize the Result
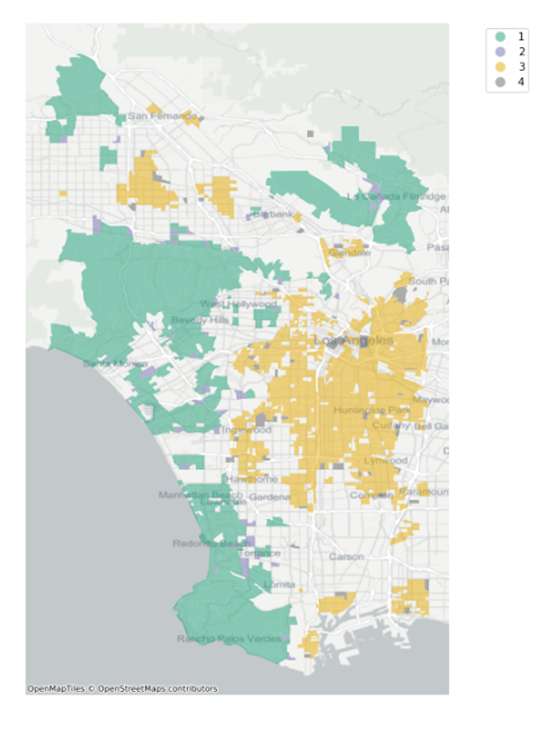
Oracle Spatial AI implements a plotting functionality for clusters in the
plot_clusters function. The following code passes the training
data and the labels as parameters. The with_noise=False parameter
avoids displaying the observations labeled with –1. The
with_basemap=True parameter sets a basemap as background.
from oraclesai.vis import plot_clusters

fig, ax = plt.subplots(figsize=(12,12))

plot_clusters(X, lisa_labels, with_noise=False, with_basemap=True, cmap='Dark2', ax=ax)
The result consists of those observations with a local Moran’s I statistically significant, colored according to their quadrant. Quadrants are defined as follows:
- A high value surrounded by high values (hot spots).
- A low value around high values (outliers).
- A low value surrounded by low values (cold spots).
- A high value around high values (outliers).
