Use Database Actions to Monitor Activity and Utilization
Database Actions provides the Database Dashboard card, with Overview and Monitor tabs to provide real-time and historical information about the utilization of an Autonomous AI Database instance.
Perform the following prerequisite steps as necessary:
-
Open the Oracle Cloud Infrastructure Console by clicking the
 next to Cloud.
 -
From the Oracle Cloud Infrastructure left navigation menu click Oracle AI Database and then click Autonomous AI Database.
To view the Overview tab that shows general information about utilization, do the following:
-
Access Database Actions as the ADMIN user.
See Access Database Actions as ADMIN for more information.
-
On the Database Actions Launchpad, under Monitoring, click Database Dashboard.
Note: You can bookmark the Launchpad URL and go to that URL directly without logging in to the Oracle Cloud Infrastructure Console. If you logout and use the bookmark, then you need to enter the ADMIN username and password, and click Sign in. See Set the ADMIN Password in Autonomous AI Database if you need to change the password for the ADMIN user.
Database Dashboard Overview
The Overview tab shows real-time and historical information about the Autonomous AI Database utilization.
The charts shown on this page include:
-
Storage: This chart shows the provisioned, allocated, and used storage. The chart indicates what percentage of the space is currently in-use.
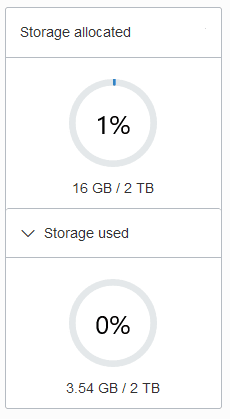
Description of the illustration adb_console_overview_storage.png
Provisioned storage is the amount of storage you select when you provision the instance or when you modify storage by scaling storage.
Storage allocated is the amount of storage physically allocated to all data tablespaces and temporary tablespaces and includes the free space in these tablespaces. This does not include storage for the sample schemas.
Storage used is the amount of storage actually used in all data and temporary tablespaces. This does not include storage for the sample schemas. The storage used is the storage in the Autonomous AI Database as follows:
-
Storage used by all database objects. Note: the chart does not include storage for the sample schemas as they do not count against your storage.
-
Storage for files users put in the file system.
-
Storage used by temporary tablespaces.
-
Used storage excludes the free space in the data and temporary tablespaces.
By default the chart does not show the used storage. Select Storage used to expand the chart to see used storage (the values are calculated when you open the chart).
For an Autonomous AI JSON Database the chart shows an additional field showing the percentage of storage used that is not storing JSON documents.
Note: If you drop an object, the space continues to be consumed until you empty the recycle bin. See Purging Objects in the Recycle Bin for more information.
See Use Sample Data Sets in Autonomous AI Database for information on sample schemas SH and SSB.
-
-
CPU utilization (%) for ECPU Compute Model: This chart shows the historical CPU utilization of the service:
-
Compute auto scaling disabled: this chart shows hourly data. A data point shows the average CPU utilization for that hour. For example, a data point at 10:00 shows the average CPU utilization for 9:00-10:00.
The utilization percentage is reported with respect to the number of ECPUs the database is allowed to use. For example, if the database has four (4) ECPUs, the percentage in this graph is based on 4 ECPUs.
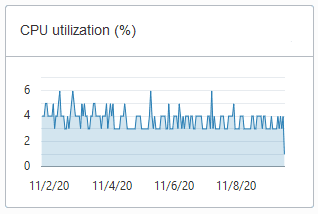
Description of the illustration adb_console_overview_number_ocpus_noauto.png
-
Compute auto scaling enabled: For databases with compute auto scaling enabled the utilization percentage is reported with respect to the maximum number of ECPUs the database is allowed to use, which is three times the number of ECPUs. For example, if the database has four (4) ECPUs with auto scaling enabled, the percentage in this graph is based on 12 ECPUs.
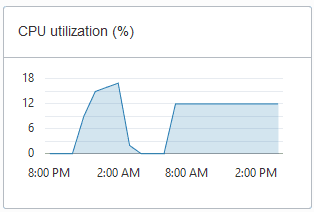
Description of the illustration adb_console_overview_cpu_util.png
-
-
CPU utilization (%) for OCPU Compute Model: This chart shows the historical CPU utilization of the service:
-
Compute auto scaling disabled: this chart shows hourly data. A data point shows the average CPU utilization for that hour. For example, a data point at 10:00 shows the average CPU utilization for 9:00-10:00.
The utilization percentage is reported with respect to the number of OCPUs the database is allowed to use. For example, if the database has four (4) OCPUs, the percentage in this graph is based on 4 OCPUs.
Description of the illustration adb_console_overview_number_ocpus_noauto.png
-
Compute auto scaling enabled: For databases with compute auto scaling enabled the utilization percentage is reported with respect to the maximum number of OCPUs the database is allowed to use. For example, if the database has four (4) OCPUs with auto scaling enabled, the percentage in this graph is based on 12 OCPUs.
Description of the illustration adb_console_overview_cpu_util.png
-
-
Running SQL statements: This chart shows the average number of running SQL statements historically. This chart shows hourly data. A data point shows the running SQL statements for that hour. For example, a data point at 10:00 shows the average number of running SQL statements for 9:00-10:00.
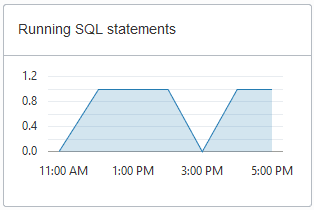
Description of the illustration adb_console_overview_running_sql.png
-
Number of ECPUs allocated (only shown for ECPU Compute Model):
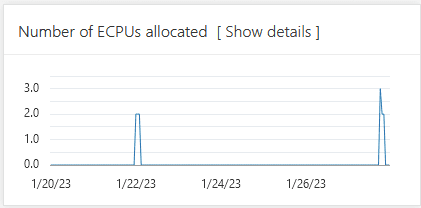
Description of the illustration adb_overview_number_ecpus.png
Notes for display results:
-
Compute auto scaling disabled: For databases with compute auto scaling disabled, for each hour the chart shows the number of ECPUs allocated to the database if the database is open for at least some part of the hour.
-
Compute auto scaling enabled: For databases with compute auto scaling enabled, for each hour the chart shows the average number of ECPUs used during that hour if that value is higher than the number of ECPUs provisioned. If the number of ECPUs used is not higher than the number of ECPUs provisioned, then the chart shows the number of ECPUs allocated for that hour.
-
Stopped Database: If the database was stopped for the full hour the chart shows 0 ECPUs allocated for that hour.
Click Show details for more information, including the number of ECPUs allocated to the database and to external resources, and the total allocated ECPUs.
The Show details view includes separate values for database ECPU usage and external resource ECPU usage. External resources include: Cloud SQL, Graph, OML4PY, and others. The Total ECPUs are the total number of ECPUs in use on the Autonomous AI Database. The external ECPUs value shows how external ECPUs contribute to the total ECPU usage.
-
-
Number of OCPUs allocated (only shown for OCPU Compute Model):
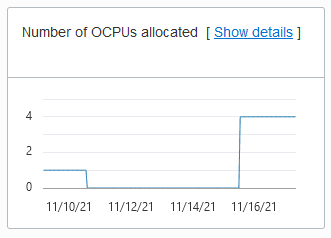
Description of the illustration adb_console_overview_number_ocpus.png
Notes for display results:
-
Compute auto scaling disabled: For databases with compute auto scaling disabled, for each hour the chart shows the number of OCPUs allocated to the database if the database is open for at least some part of the hour.
-
Compute auto scaling enabled: For databases with compute auto scaling enabled, for each hour the chart shows the average number of OCPUs used during that hour if that value is higher than the number of OCPUs provisioned. If the number of OCPUs used is not higher than the number of OCPUs provisioned, then the chart shows the number of OCPUs allocated for that hour.
-
Stopped Database: If the database was stopped for the full hour the chart shows 0 OCPUs allocated for that hour.
Click Show details for more information, including the number of OCPUs allocated to the database and to external resources, and the total allocated OCPUs.
The Show details view includes separate values for database OCPU usage and external resource OCPU usage. External resources include: Cloud SQL, Graph, OML4PY, and others. The Total OCPUs are the total number of OCPUs in use on the Autonomous AI Database. The external OCPUs value shows how external OCPUs contribute to the total OCPU usage.
-
-
SQL statement response time (s): This chart shows the average response time, in seconds, of SQL statements historically. This chart shows hourly data. A data point shows the average SQL statement response time for that hour. For example, a data point at 10:00 shows the average SQL statement response time, in seconds, for the hour from 9:00-10:00.

Description of the illustration adb_console_overview_sql_statement_response.png
- SQL statements executed per second
Note: Database Dashboard does not show this chart when the Autonomous AI Database instance workload type is Lakehouse.
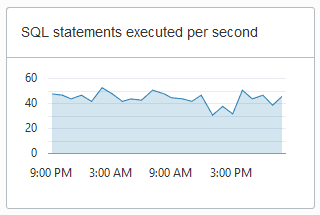
Description of the illustration adb_console_overview_sql_statements.png
The default retention period for performance data is thirty (30) days. The CPU utilization, running statements, and average SQL response time charts show data for the last eight (8) days by default.
You can change the retention period by modifying the Automatic Workload Repository retention setting with the PL/SQL procedure DBMS_WORKLOAD_REPOSITORY.MODIFY_SNAPSHOT_SETTINGS(). The maximum retention you can set is 30 days. See Oracle AI Database PL/SQL Packages and Types Reference.
If you need to store more performance data you can use the OCI Ops Insights AWR Hub. See Analyze Automatic Workload Repository (AWR) Performance Data for more information.
Database Dashboard Activity
The Monitor tab shows real-time and historical information about the Autonomous AI Database performance data, activity, and utilization.
Note: The default view in the Monitor tab is real-time. This view shows performance data for the last hour.
The charts on this page are:
-
Database Activity
This chart shows the average number of sessions in the database using CPU or waiting on a wait event. See Oracle AI Database Reference for more information on wait events.
-
CPU Utilization (with ECPU compute model)
This chart shows the CPU utilization of each consumer group. The utilization percentage is reported with respect to the number of ECPUs the database is allowed to use. For example, if the database has four (4) ECPUs, the percentage in this graph is based on 4 ECPUs.
For databases with compute auto scaling enabled the utilization percentage is reported with respect to the maximum number of ECPUs the database is allowed to use, which is three times the number of ECPUs. For example, if the database has four (4) ECPUs with auto scaling enabled, the percentage in this graph is based on 12 ECPUs.
See Manage Concurrency and Priorities on Autonomous AI Database for detailed information on consumer groups.
-
CPU Utilization (with OCPU compute model)
This chart shows the CPU utilization of each consumer group. The utilization percentage is reported with respect to the number of OCPUs the database is allowed to use. For example, if the database has four (4) OCPUs, the percentage in this graph is based on 4 OCPUs.
For databases with compute auto scaling enabled the utilization percentage is reported with respect to the maximum number of OCPUs the database is allowed to use. For example, if the database has four (4) OCPUs with auto scaling enabled, the percentage in this graph is based on 12 OCPUs.
See Manage Concurrency and Priorities on Autonomous AI Database for detailed information on consumer groups.
-
Running Statements
This chart shows the average number of running SQL statements in each consumer group.
See Manage Concurrency and Priorities on Autonomous AI Database for detailed information on consumer groups.
-
Queued Statements
This chart shows the average number of queued SQL statements in each consumer group.
See Manage Concurrency and Priorities on Autonomous AI Database for detailed information on consumer groups.
To see earlier data click Time period. The default retention period for performance data is thirty (30) days. By default in the Time Period view the charts show information for the last eight (8) days.
In the time period view you can use the calendar to look at a specific time period in the past 30 days. You can also use the time slider to change the period for which performance data is shown.
Note: The retention time can be changed by changing the Automatic Workload Repository retention setting with the PL/SQL procedure DBMS_WORKLOAD_REPOSITORY.MODIFY_SNAPSHOT_SETTINGS. Be aware that increasing the retention time results in more storage usage for performance data. See Oracle AI Database PL/SQL Packages and Types Reference.