Create a SQL Property Graph from an RDF Graph
You can create a SQL property graph from an existing RDF graph in Graph Studio if you are using an Autonomous AI Database instance with Oracle AI Database 26ai.
- Navigate to the Graphs page using the Graphs menu link.
- Click the RDF Graph tab.The list of RDF graphs to which you have access are displayed as shown:

Description of the illustration create_sqlpg_from_rdf_menu.png - Select the RDF graph from which you want to create a SQL property graph and click open the additional options menu as shown in the preceding figure.
- Click Create Property Graph in the context menu.The modeler interface opens and displays the Overview page as shown:
- Enter the Graph Name.
- Select SQL Property Graph for Graph Type and
click Next.The Define Graph page opens as shown:
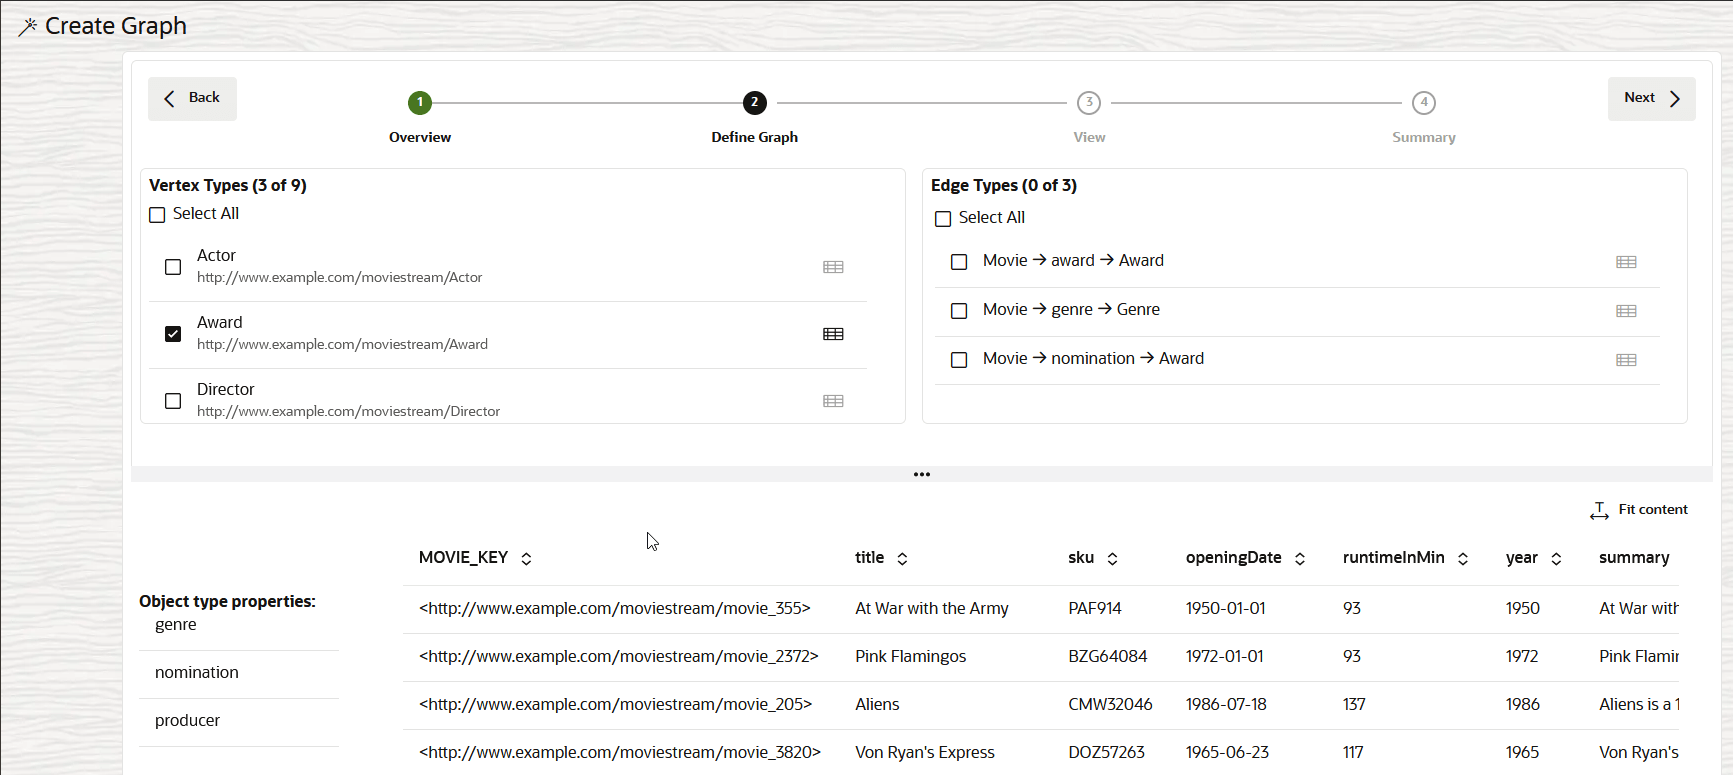
Description of the illustration rdf_sql_pg_define_vertex_types.png
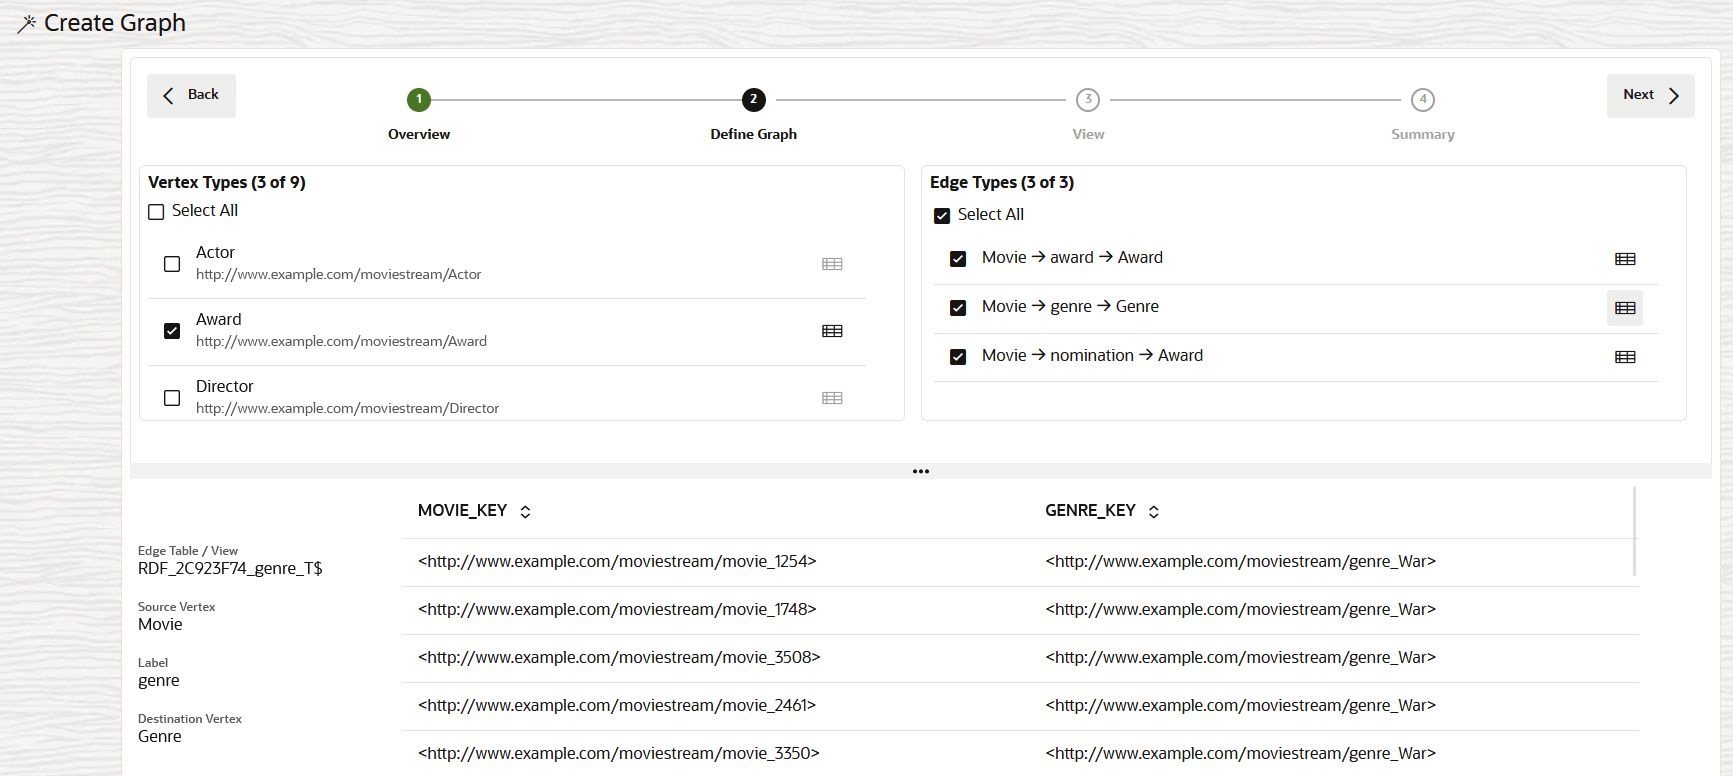
This page displays the list of RDF classes under Vertex Types in the top left panel. You can inspect an RDF class to view the sample data and the corresponding Object type properties in the bottom panel.
- Select the RDF classes to define the required Vertex
Types for the graph.The modeler interface automatically deducts the edges for the selected vertex types and these are listed under Edge Types in the top right panel. You can inspect an edge type to view detailed information, such as the edge label, the source and destination vertex types, and sample data showing the source and destination vertex keys in the bottom panel.
- Select the required edge types in the top right Edge Types section.
- Click Next to proceed.The View page of the workflow opens as shown:
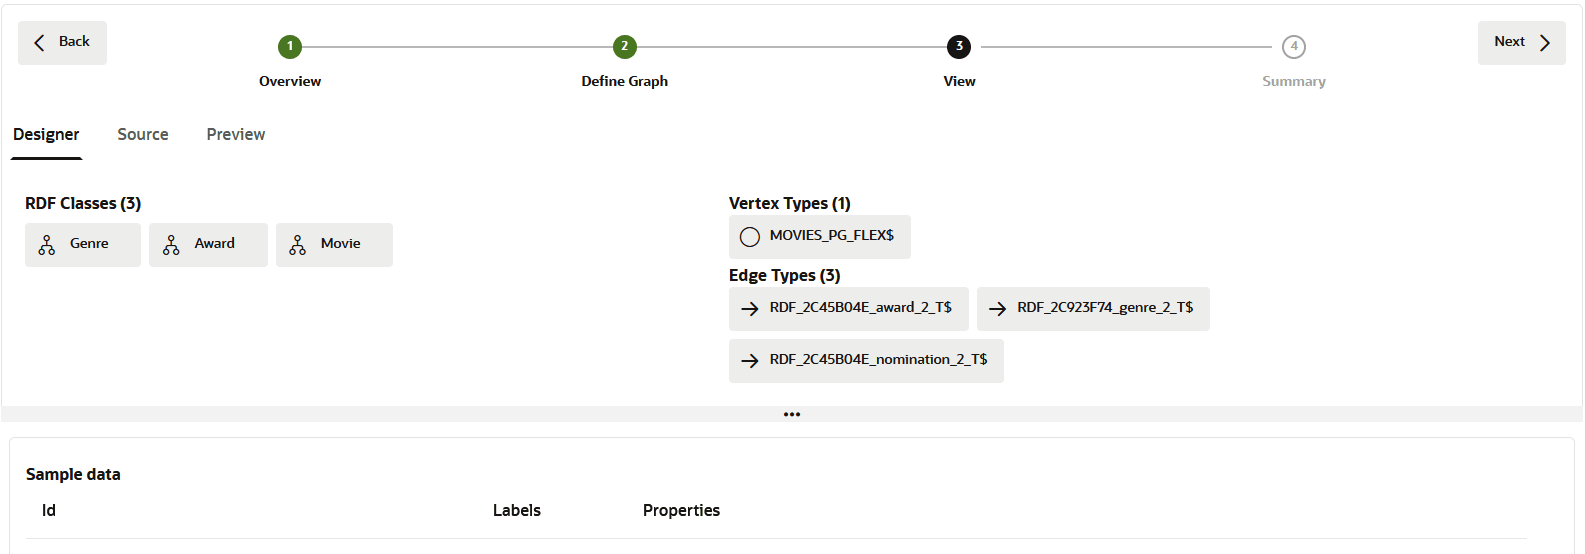
Description of the illustration rdf_sql_pg_model.png
This page comprises the following three tabs:
- Designer: You can review the selected RDF classes on
the left and the corresponding vertex and edges types on the top right
panel. Also, note the following:
- You can click on an RDF class to view a sample of the data in the bottom panel.
- You can click on the vertex type to view a sample
of the resulting vertex table (that follows the format
<graph_name>_FLEX$) in the bottom panel. This table holds data for all the RDF classes that are selected for this graph creation. It gets created with three fixed columns in the following order:Id:Key value of an RDF class.Labels:Name of an RDF class.Properties:Label properties (associated with theId) as key-value pairs in JSON format. Therefore, multiple properties with multiple values are supported.
- You can click on an edge type to view detailed information, such as the edge label, the source and destination vertex types, and a sample data showing the source and destination vertex keys in the bottom panel.
- Source: Displays the
CREATE PROPERTY
                                GRAPH
DDL statement that will be executed to create the SQL property graph. - Preview: Displays a graph visualization of the selected RDF classes and the connecting edges.
- Designer: You can review the selected RDF classes on
the left and the corresponding vertex and edges types on the top right
panel. Also, note the following:
- Click Next to view the property graph Summary.
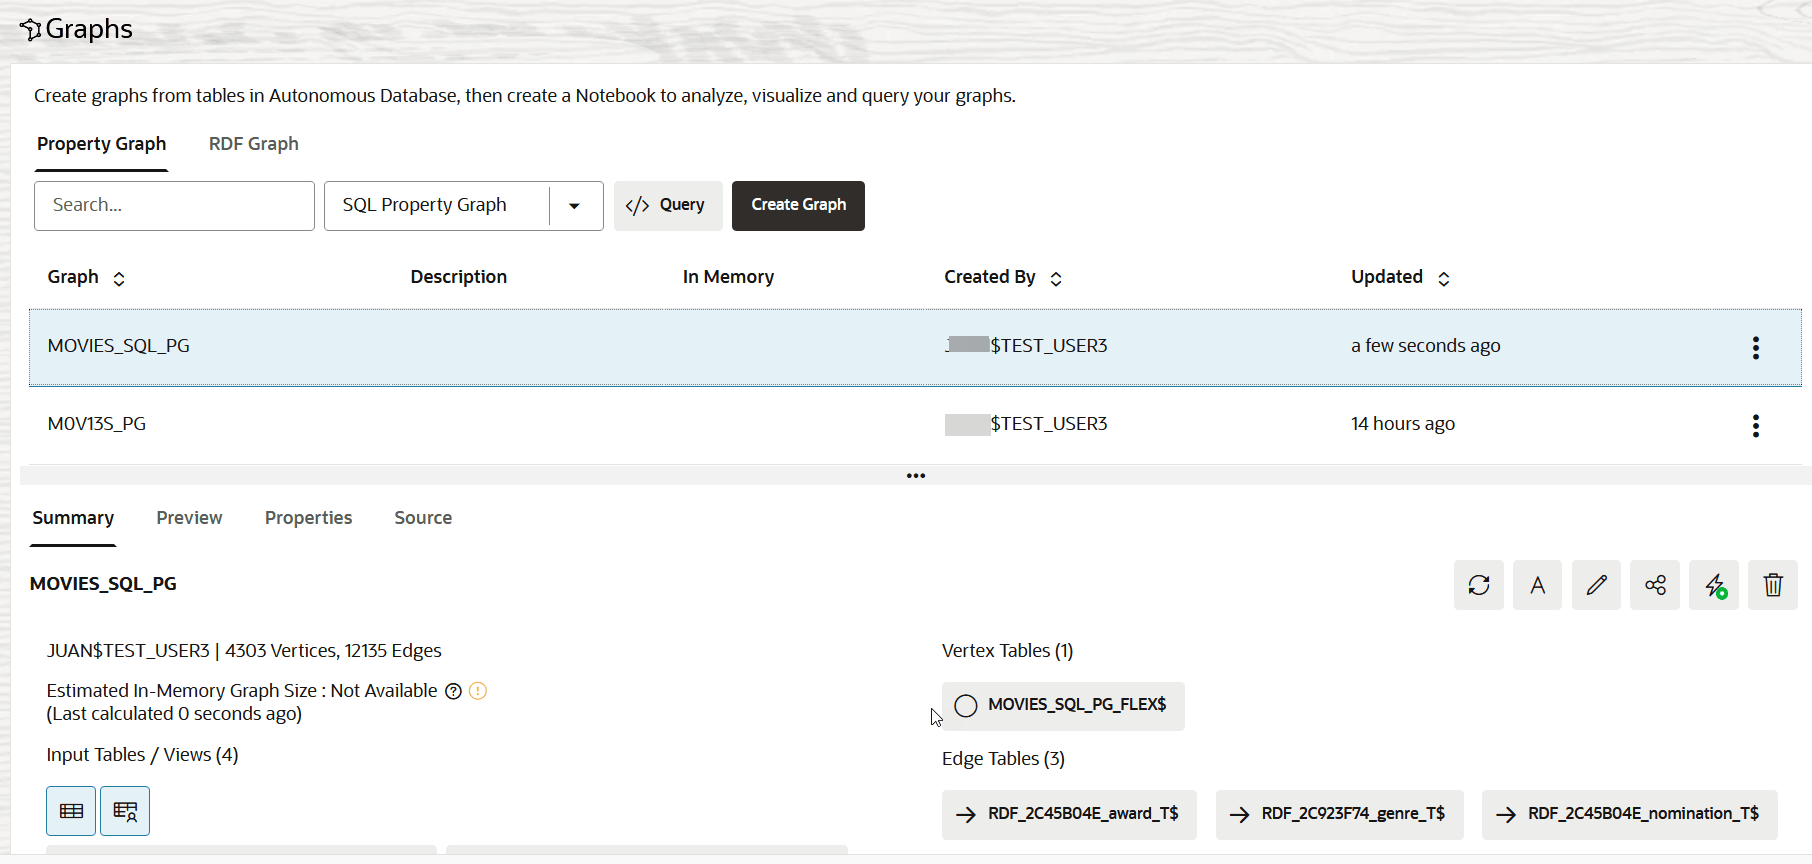
- Click Create Graph.The graph creation job is initiated on the Jobs page. The job entails creation of the vertex and edge tables, followed by the execution of the SQL DDL statement to create the SQL Property Graph. Once the job completes successfully, you can view the newly created SQL property graph on the Graphs page in the Property Graph tab.
Note:
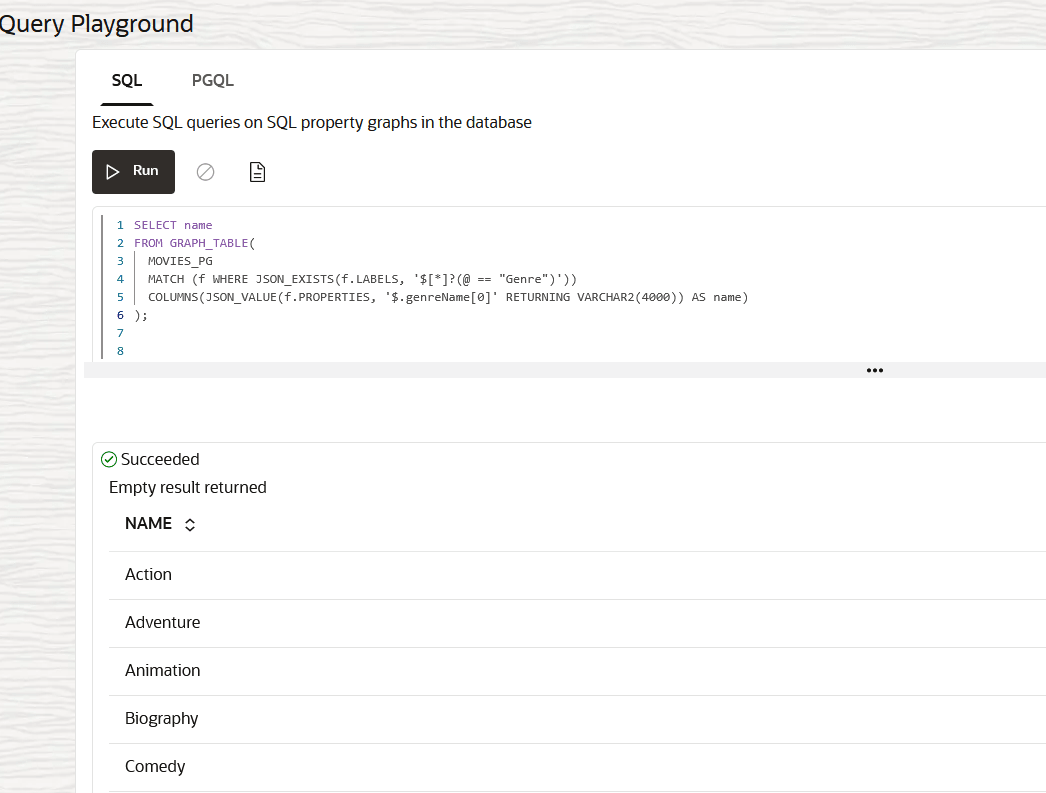
If the underlying vertex or edge table contains multiple labels, then the SQL property graph cannot be loaded into the graph server memory (PGX).You can then run SQL queries on the graph in the Query Playground page or analyze and visualize the graph using a Notebook.
The following figure shows an example SQL graph query that is executed on the graph in the Query Playground page:

