Before you Begin
This tutorial shows you how to configure a presentation using Auto mode in Oracle Analytics.
Background
In an Oracle Analytics workbook, you create visualizations using charts, maps, graphs, and other graphical representations to aid consumers in understanding complex data. You can configure a workbook's presentation settings to customize the consumers' view by setting workbook and canvas properties, specifying interactivity, and arranging the canvases to curate the end users' experience. You can also use the presentation settings to specify how your consumers move from one canvas to the next.
In this tutorial, you use Auto mode to learn what you can do with a workbook's presentation settings. Oracle Analytics maintains synchronicity between the canvases in the workbook editor and the canvases in the consumer view when you use Auto mode. As a result, you must rename and rearrange the canvases in the workbook editor or in Manual mode  .
.
What Do You Need?
- Access to Oracle Analytics
- Access to the Sales and Profit workbook created in the Create Workbook Canvases and Visualizations in Oracle Analytics tutorial or a workbook with multiple canvases and visualizations
Create a Presentation
In this section, you create a presentation from an existing workbook with multiple canvases in the Auto mode  . Your changes are limited in Auto mode to maintain the synchronicity with the workbook editor canvas.
- On your home page, hover over the Sales and Profit workbook, click Actions
 , and then click Open.
 - In the workbook, click Edit.
The workbook opens in the workbook editor.
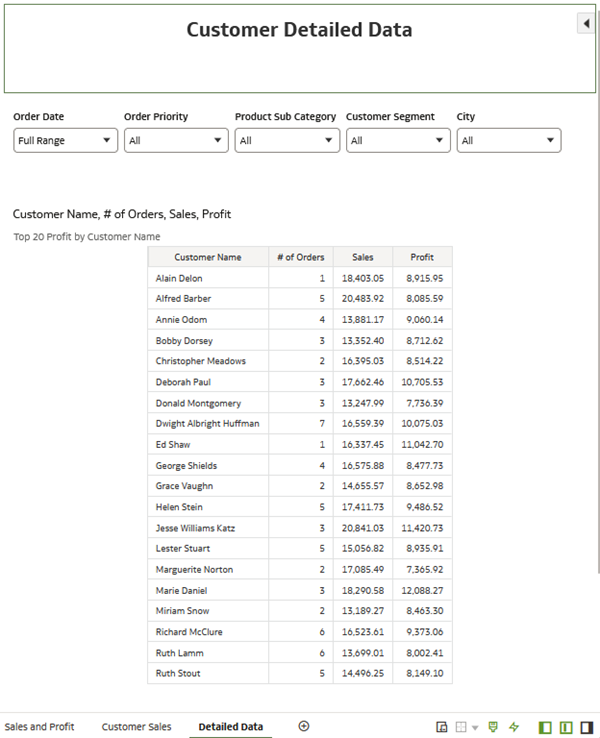
Description of the illustration visualize.png - From the Preview menu, click Configure Presentation.
Oracle Analytics automatically adds the workbook's canvases to the presentation in the Auto mode active state.
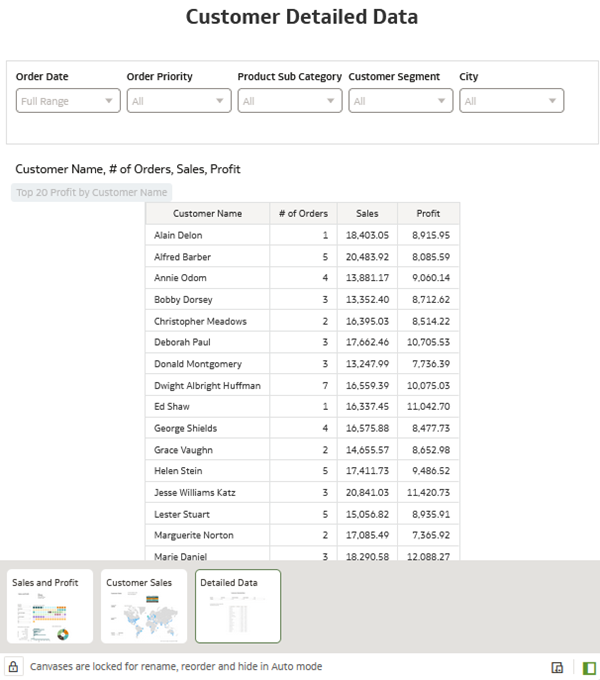
Description of the illustration present_w_canvases.png - Click menu
 on the Detailed Data canvas and select Hide Canvas.
 - Click Save
 . Click Preview
  .
.When the canvas uses the freeform layout the zoom
 icon displays in the menu bar to let users get a larger view of the visualizations. You can disable the zoom option in the Workbook tab of the presentation settings page.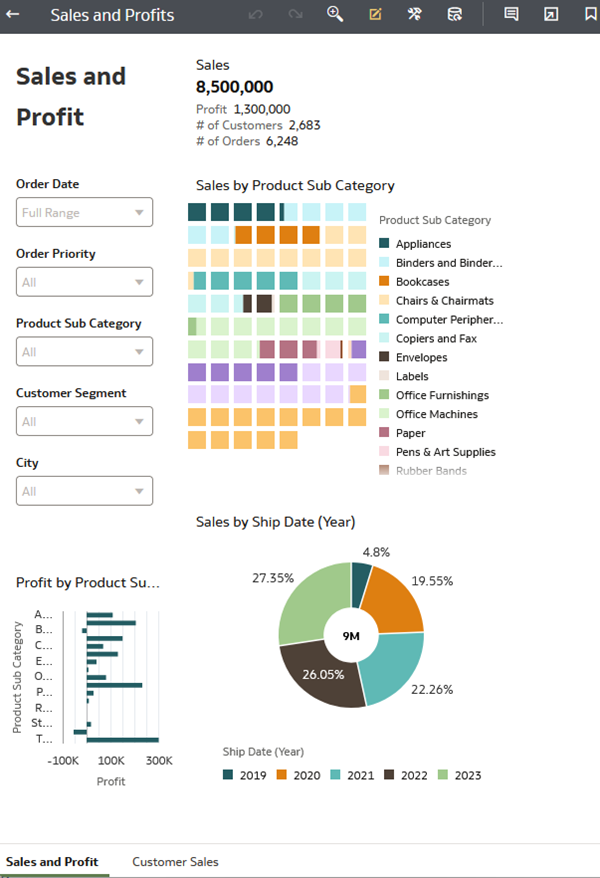
Description of the illustration present_hidden_canvas.png
Applying Changes to the Presentation
In this section, learn what happens when you make changes in the presentation canvases.
- Click Edit. From the Preview menu, click Configure Presentation.
- Click menu on the grayed Detailed Data canvas and select Show Canvas.
- In the Detailed Data canvas, click All in Order Priority.
The filters in the dashboard filter control aren't available for update in Auto mode.
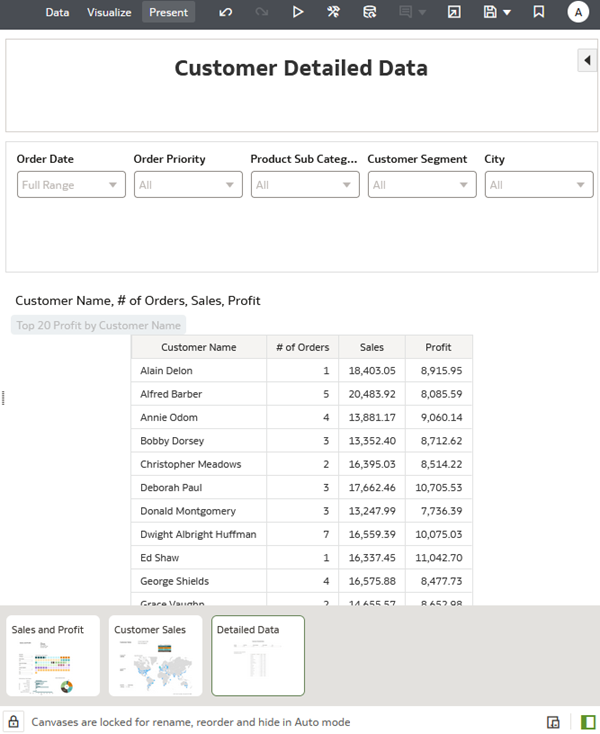
Description of the illustration no_changes_auto_mode.png - Click Switch to Manual mode to make changes.
- Click Save .
Learn More
Create a Presentation Using Auto Mode in Oracle Analytics
F86647-05
September 2026
Learn how to create a presentation with Auto mode in Oracle Analytics.
This software and related documentation are provided under a license agreement containing restrictions on use and disclosure and are protected by intellectual property laws. Except as expressly permitted in your license agreement or allowed by law, you may not use, copy, reproduce, translate, broadcast, modify, license, transmit, distribute, exhibit, perform, publish, or display any part, in any form, or by any means. Reverse engineering, disassembly, or decompilation of this software, unless required by law for interoperability, is prohibited.
If this is software or related documentation that is delivered to the U.S. Government or anyone licensing it on behalf of the U.S. Government, then the following notice is applicable:
U.S. GOVERNMENT END USERS: Oracle programs (including any operating system, integrated software, any programs embedded, installed or activated on delivered hardware, and modifications of such programs) and Oracle computer documentation or other Oracle data delivered to or accessed by U.S. Government end users are "commercial computer software" or "commercial computer software documentation" pursuant to the applicable Federal Acquisition Regulation and agency-specific supplemental regulations. As such, the use, reproduction, duplication, release, display, disclosure, modification, preparation of derivative works, and/or adaptation of i) Oracle programs (including any operating system, integrated software, any programs embedded, installed or activated on delivered hardware, and modifications of such programs), ii) Oracle computer documentation and/or iii) other Oracle data, is subject to the rights and limitations specified in the license contained in the applicable contract. The terms governing the U.S. Government's use of Oracle cloud services are defined by the applicable contract for such services. No other rights are granted to the U.S. Government.
This software or hardware is developed for general use in a variety of information management applications. It is not developed or intended for use in any inherently dangerous applications, including applications that may create a risk of personal injury. If you use this software or hardware in dangerous applications, then you shall be responsible to take all appropriate fail-safe, backup, redundancy, and other measures to ensure its safe use. Oracle Corporation and its affiliates disclaim any liability for any damages caused by use of this software or hardware in dangerous applications.
Oracle and Java are registered trademarks of Oracle and/or its affiliates. Other names may be trademarks of their respective owners.
Intel and Intel Inside are trademarks or registered trademarks of Intel Corporation. All SPARC trademarks are used under license and are trademarks or registered trademarks of SPARC International, Inc. AMD, Epyc, and the AMD logo are trademarks or registered trademarks of Advanced Micro Devices. UNIX is a registered trademark of The Open Group.
This software or hardware and documentation may provide access to or information about content, products, and services from third parties. Oracle Corporation and its affiliates are not responsible for and expressly disclaim all warranties of any kind with respect to third-party content, products, and services unless otherwise set forth in an applicable agreement between you and Oracle. Oracle Corporation and its affiliates will not be responsible for any loss, costs, or damages incurred due to your access to or use of third-party content, products, or services, except as set forth in an applicable agreement between you and Oracle.