Manage Diagnostic Service Logs in Oracle Access Governance

Oracle Cloud Infrastructure (OCI) services generate service logs that you can enable for a resource to centrally manage all the critical diagnostic information using the OCI Console.

To work with service logs, you must first enable them.

You must note that service logs are displayed for operations that result in a failure and for those that contain debugging information. This includes:
  • Campaign launch failures (where a campaign enters a 'System ended' state)
  • Access bundle deletion failures
  • Data load failures
  • Insights failures
  • Email notification failures
  • Remediation failures
  • Ingestion failures
  • Inbound and Outbound diagnostic logs

Enable Service Log for a Resource in Oracle Access Governance

You can enable service logs for a resource, which refers to an Oracle Access Governance service instance.

You must note that logging is configured distinctly for each service instance. This implies that each service instance within a compartment has its own distinct service log entry.

  1. Sign in to the Oracle Cloud Infrastructure Console with a user assigned with the Access Control Administrator application role.
  2. Open the Navigation menu Navigation icon and select Observability & Management. Under Logging, select Logs.
    The Logs page is displayed.
  3. Under List scope panel, from the Compartment list select a compartment that you have permission to work in.
  4. Under Filters panel, from the Log Group list select a log group to place the service log into.

    Note:

    If a log group does not exist, you will see an option to create one by using the Show Advanced Options feature on the Enable Resource Log panel in Step 9.
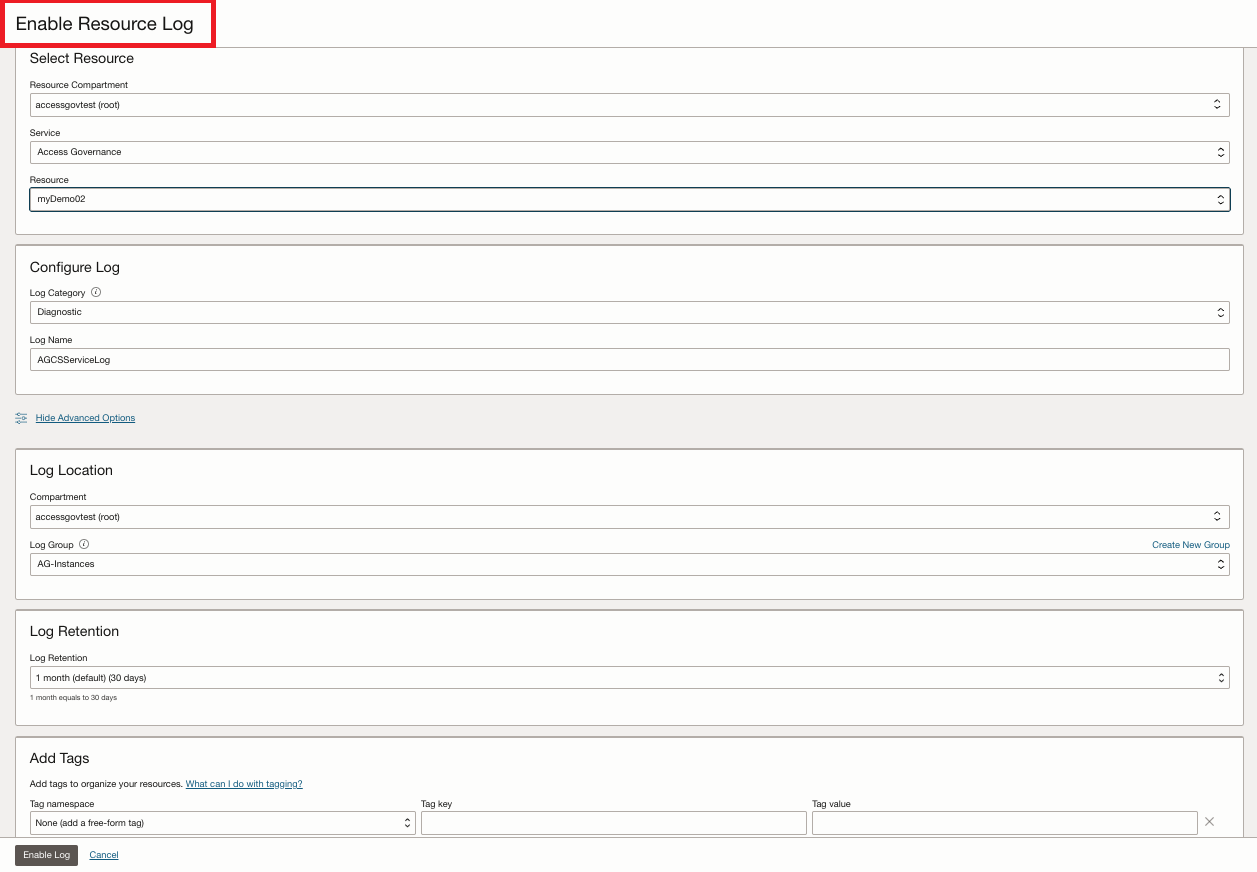
  5. Click Enable service log. The Enable Resource Log panel opens.
    Enable Resource Log Panel

  6. Under Select Resource, configure a resource:
    1. The Resource Compartment list box is pre-populated with the compartment name selected in Step 3.
    2. From the Service list box, select a specific service for which you want to enable service logging. For instance, you would select Access Governance.
    3. From the Resource list box, select a resource. For instance, AG1, which is an Oracle Access Governance service instance.

      Note:

      The Resource list box displays all service instances created within a compartment. For example, if a compartment contains three service instances, then all three will be listed distinctly in the Resource list box.
  7. Under Configure Log, set up the service log:
    1. From the Log Category list box, select Diagnostic.
    2. In the Log Name field, specify a name for the service log.
  8. Click Show Advanced Options to configure more options for the service log.
  9. Under Log Location panel, configure the log location:
    1. The Compartment list box is pre-populated with the compartment name selected in Step 3.
    2. In Log Group, create a new log group if it does not exist by clicking Create New Group. In the Create Log Group panel, enter the following values:
      • Compartment: Specifies the compartment in which you want to create the log group. This field is pre-populated based on your compartment choice in step 3.
      • Name: Enter a name for this log group.
      • Description: Enter a description for this new log group.
      • Enter tagging information. This is optional.
      • Click Create.
  10. From the Log Retention list box, select a value to configure the log retention period.
  11. Apply any tagging-related information in the Tag namespace, Tag key, and Tag value fields to organize and list resources based on your business needs.
  12. Click Enable Log.

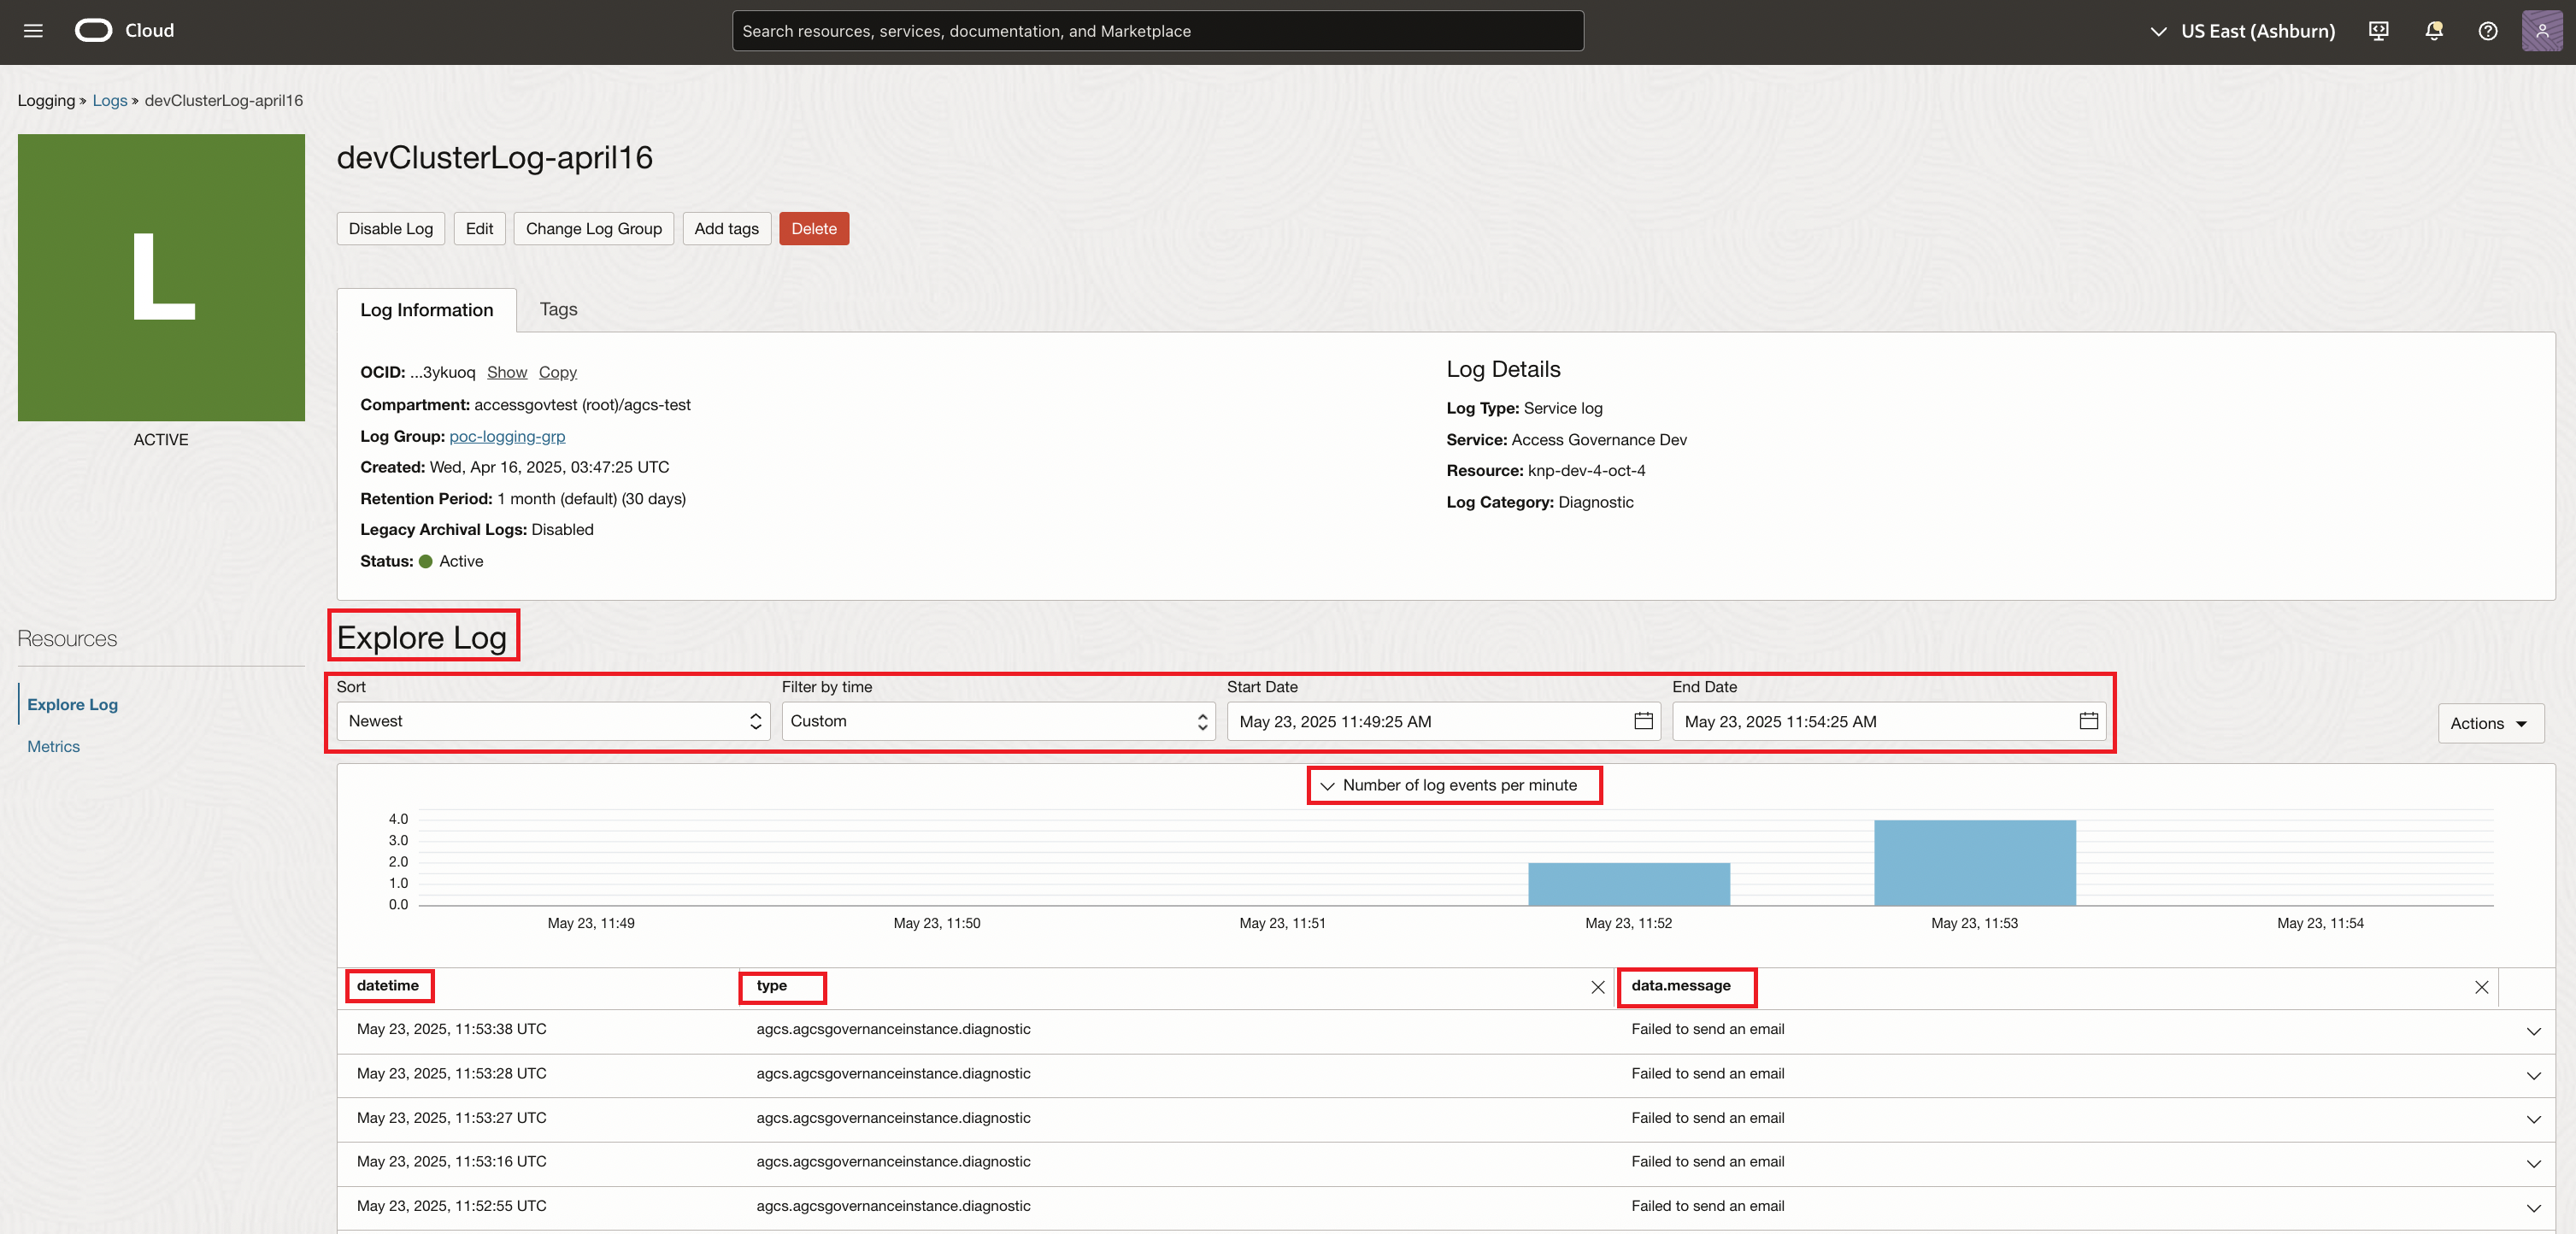
    The Log Information page will appear, displaying a "Creating log" message to indicate that the log is being set up. Wait for a few minutes until the log status is updated to Active in the Log Information tab.


    Log Information Page

Once the service log is successfully enabled and its status is Active the Explore Log area becomes visible, allowing you to effectively analyze the service log data.

You are also presented several options to manage service logs once enabled:
  • Disable Log: Sets the log status to INACTIVE.
  • Edit: Allows modification of the service log name or log retention settings.
  • Change Log Group: Moves the service log to another log group.
  • Add Tags: Enables you to add tags for resource organization.
  • Delete: Deletes the service log.

View the Details of Service Logs

After logging is enabled, click the link under Log name to view the log details.

  1. Sign in to the Oracle Cloud Infrastructure Console with a user assigned with the Access Control Administrator application role.
  2. Open the Navigation menu Navigation icon and select Observability & Management. Under Logging, select Logs.
    The Logs page is displayed.
  3. Under List scope panel, from the Compartment list box select the compartment containing the desired log that you want to view.
  4. Click the link under Log name to view the details of the specific service log.

    The log details page opens with the Log Information tab selected.


    Log Information Tab

  5. In the Explore Log area, apply some simple filters, such as sorting by Newest or Oldest from the Sort field or filtering by time from the Filter by time field.

    In the Explore Log area, a Number of log events per minute bar graph displays the number of log events, according to your filter settings.

    Based on your filter settings, the logs search results are generated. Each log entry has three interactive header columns, which correspond to: the log timestamp (datetime), the plugin where the log occurred (type), and the log message (data.message).


    Explore Log Area

  6. In the Explore Log area, select one of the following options to view detailed information about the service log.
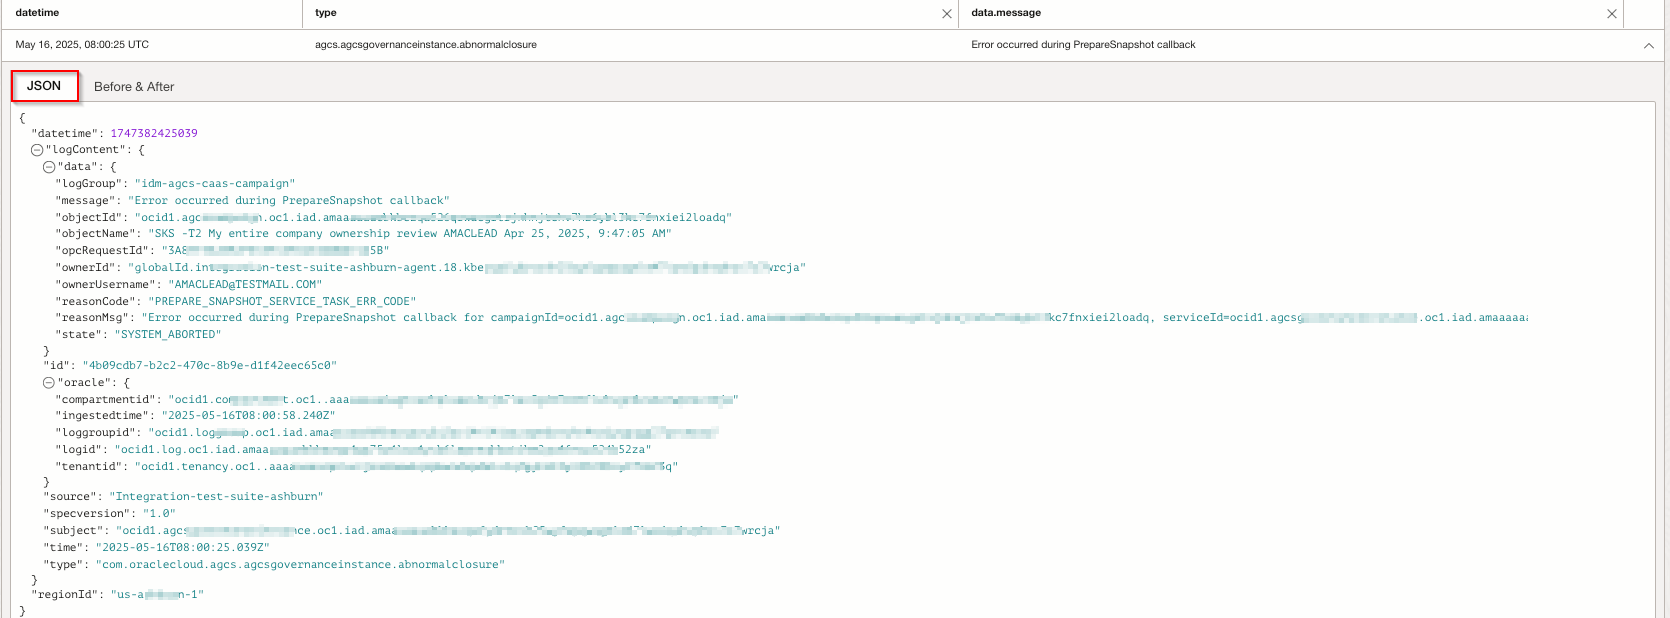
    1. To view detailed information about a single log entry, click the down arrow (down arrow icon) to expand the log entry for which you want to view the details.

      The JSON view is displayed with JSON tab selected.


      JSON View

      In JSON view you can view the log data fields and values, collapse and expand nodes, or click the copy icon to copy the log entry to the clipboard.

    2. To view this log on the Search page directly, click the Actions menu and select Explore with Log Search.

      The Search page appears with the Select logs to search field pre-populated with the current log filter. You can now perform a detailed analysis of this log directly on the Search page.

Search Service Logs

Use the Logging Search page to perform a detailed analysis and investigation of the service logs, apply filters, visualize log data, explore logs in JSON view, and export search results.

To search logs, you must first enable them.

By default, logs are indexed, allowing you to search them via the Oracle Cloud Infrastructure (OCI) Console using either the Basic Mode with custom filter controls or Advanced Mode with a custom query option. See Logging Search to learn more about search results, and Visualizing Search Results for more information on visualizing searches.

Example: Consider a scenario where an operation, such as campaign creation fails, indicated by a “System ended” status message in the Oracle Access Governance Service Instance Console. If you want to view the corresponding log details for this campaign in the OCI Console using the Basic Mode, perform the following steps.
  1. Sign in to the Oracle Cloud Infrastructure Console with a user assigned with the Access Control Administrator application role.
  2. Open the Navigation menu Navigation icon and select Observability & Management. Under Logging, select Search.
    The Search page is displayed.
  3. On the Search panel, perform the following tasks to filter the log details.
    1. In Select logs to search, the root compartment is already selected by default for filtering. Click this field to open the Select logs to search panel, where you can filter by Compartment, Log Groups, and Logs.
    2. From the Filter by time list, select a predetermined time range to limit the search results. You can also select Custom to specify a date range in the calendar Start Date and End Date.
    3. From the Filter by time list, select a predetermined time range to limit the search results. You can also select Custom to specify a date range in the calendar Start Date and End Date.
    4. In Custom filters field, start typing to display filter settings to create a custom query. Entering ‘d’ displays filters starting with that letter. Select a pre-defined filter from the list or type in your specific filter criterion.

      Note:

      The search results are automatically loaded as you apply filters. Therefore, you do not have to click the Search button every time you update the filters. However, if some time is elapsed and new logs are generated, you need to click Search again to fetch the latest entries.

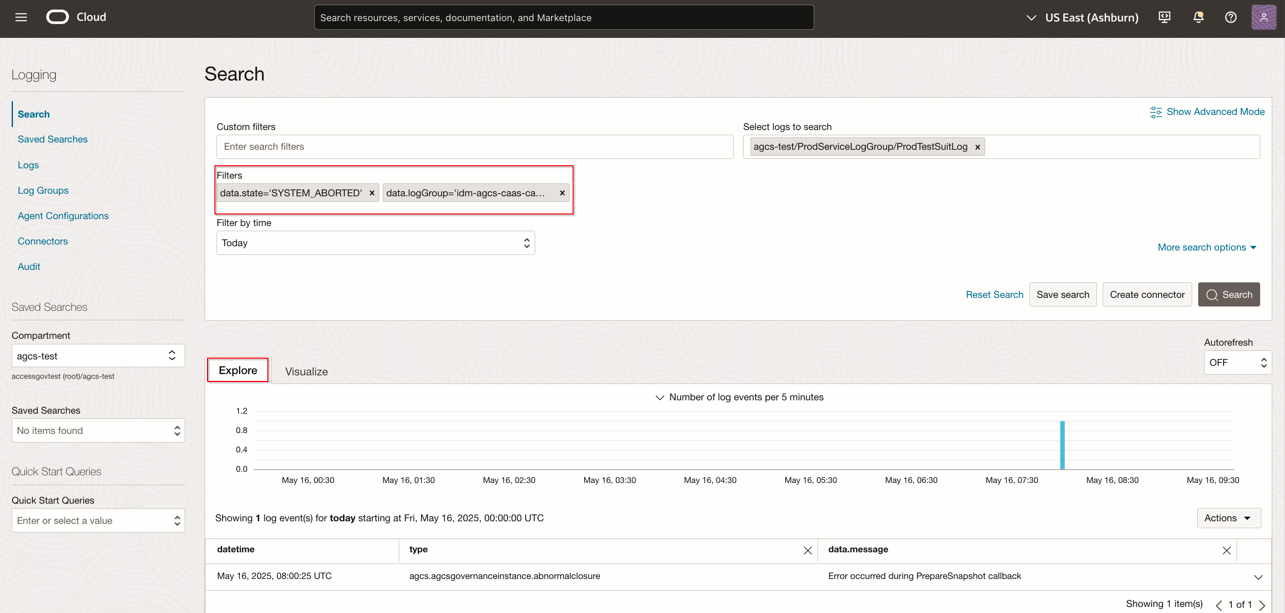
      Example: You can view the service log details for a campaign that was aborted with a System ended status in Oracle Access Governance Service Instance Console by defining the following custom filter: data.logGroup='idm-agcs-caas-campaign' and data.state='SYSTEM_ABORTED'.

      The log data is loaded in the Explore and Visualize tabs according to your filter settings.


      Search Page

  4. In the Explore tab, select one of the following options to view detailed information about the log.
    1. To view detailed information about a single log entry, click the down arrow (down arrow icon) to expand the log entry for which you want to view the details.

      The JSON view is displayed with JSON tab selected.

    2. To examine all log data, on the Explore tab, click the Actions menu, and then select Expand log data.

      All the log entries from your search are fully expanded.

    To explore the features for viewing and managing search results on the Search page, see Viewing and Working with Search Results.