Using the Show Analytics Option
You can analyze the enterprise process by using the Show Analytics option in the model toolbar.
The system displays the changes on the enterprise process diagram and analytics tabs when you make changes in the Analytics Options pane.
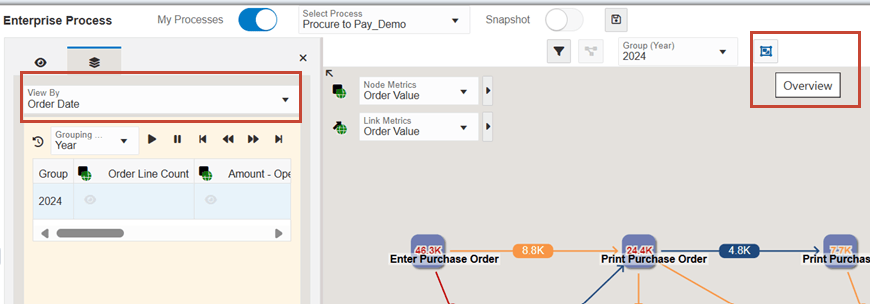
- In the model toolbar, click Show Analytics Options
 . The system displays the left pane along with the View By drop-down
list.
. The system displays the left pane along with the View By drop-down
list. In the View By drop-down list, the Overview option is selected by default. You can select from the other available options. The other options are displayed based on the template.
If you select an option other than Overview, either a Timeline view (for Date and UTIME data types) or a Domain view (for other data types) is displayed.
(Tools Release 9.2.9.3) If you select an option other than Overview, the system displays the Overview icon next to the Group drop-down list. Click this icon to reset the value in the View By drop-down list to Overview.
Timeline View for Date and UTime Data Types
The system displays a Timeline View
 indicator when you select a Date or an UTIME data type from the View By
drop-down list.
indicator when you select a Date or an UTIME data type from the View By
drop-down list.You can use the following options to analyze the process:
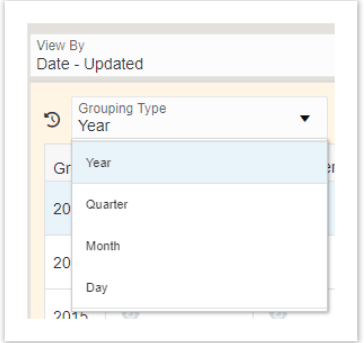
Select any of these options from the Grouping Type drop-down list: Year (calendar year), Quarter (calendar quarter), Month, and Day.
.
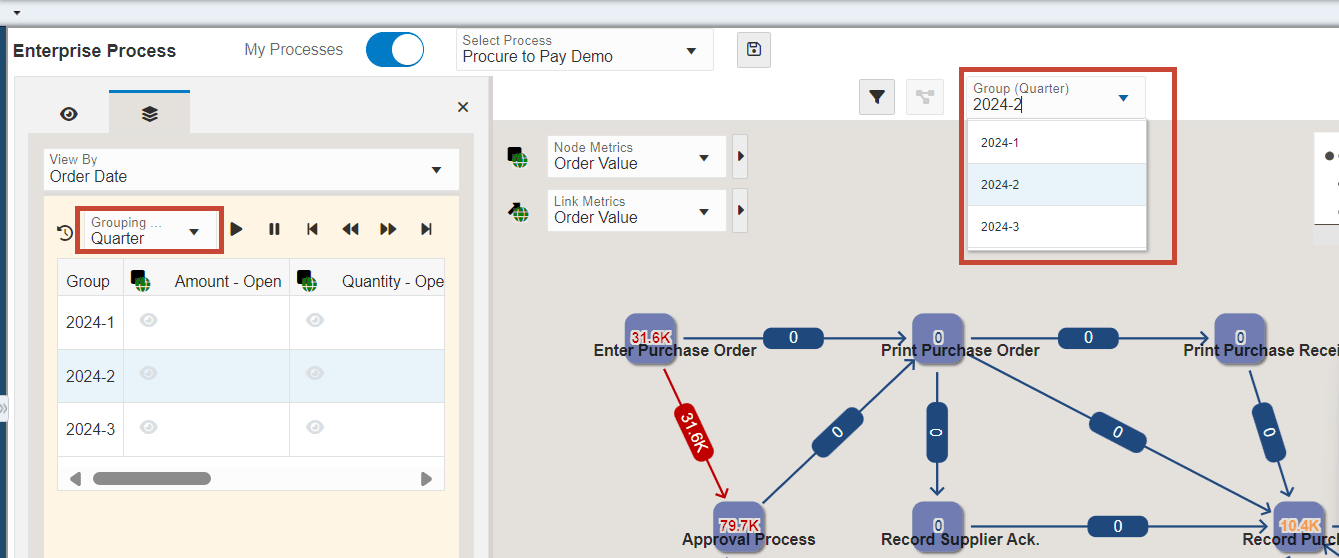
When you select a value from the Grouping Type drop-down list, the system displays a corresponding new drop-down list above the model pane.
For example, if you select Grouping Type as Year, Quarter, or Month, a new drop-down list called Group (Year), Group (Quarter), or Group (Month) is displayed.
Select a value from the Group (Quarter) drop-down list (either from the field in the Display Options pane or the field above the model pane). The system displays the corresponding data on the enterprise process diagram and on the analytics tabs on the right.
-
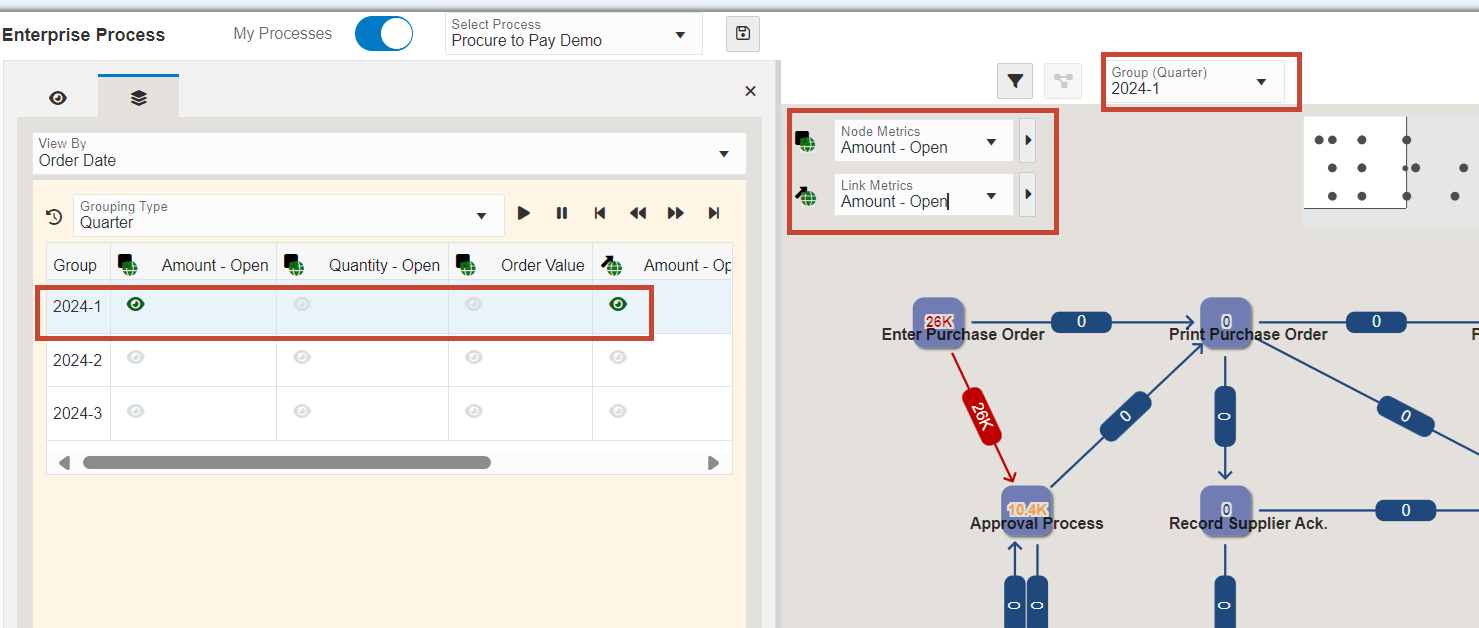
To analyze the enterprise process using different values, click the Select Metrics icon
 on the rows to select a value for the Node and Link Metrics.
The system changes the values accordingly in the Node Metrics and Link
Metrics fields and displays the changes on the enterprise process
diagram and analytics tab on the right.
on the rows to select a value for the Node and Link Metrics.
The system changes the values accordingly in the Node Metrics and Link
Metrics fields and displays the changes on the enterprise process
diagram and analytics tab on the right.The node and link metrics are selected for the first available value from the Grouping Type drop-down list by default.
For example, in the following screenshot, in the 2024-1 row, the metrics are selected (indicated by the Select Metrics icon) for the Amount-Open columns for Node Metrics and Link Metrics. The Amount-Open value is selected in the Node Metrics and Link Metrics fields in the model pane too.
-
Use the following group navigation controls to view a specific data: Start, Pause, Begin, Previous, Next, and End.
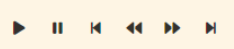 .When you click the Start icon, the system plays back data from all the rows in the selected group from beginning to end in order. The system displays the changes on the enterprise process diagram and the analytics tabs during the playback.Note: The playback is indicated by a "moving hand on the clock"
 effect.
You can click Pause to interrupt the playback.
Domain View for Other Data Types
The system displays a Domain View
 indicator when you select a data type other than Date or UTIME the View
By drop-down list.
indicator when you select a data type other than Date or UTIME the View
By drop-down list.You can use the following options to analyze the process:
-
The system displays the Group drop-down list above the model pane when you select any data type other than Date or UTIME. The first group is select by default in the Group drop-down list. Click the Group drop-down list to select a new value.
-
Click the Select Metrics
icon on the rows to select a value for Node and Link Metrics.
The system changes the values accordingly in the Node Metrics and Link
Metrics fields and displays the changes on the enterprise process
diagram and analytics tabs on the right.By default, the node and link metrics are selected (indicated by the Select Metrics
icon) for the first group in the Domain View panel.
-
Click the Begin, Previous, Next, and End icons
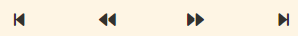 to view the Node and Link metrics of different groups.
 -
Click the Hide View Options icon (X) to close the Analytics Options pane.