UX One: Service Team Cost Performance Page
The Service Team Cost Performance page (P17006X/W17006XD) enables users to view analytical cost information about work orders and contracts, and to compare actual cost to the budgeted cost. The page also enables users to easily access programs that enable them to act on the cost information they see.
To access the UX One Service Team Cost Performance page, log in to the EnterpriseOne system using the Field Service Manager role. When you log in with this role, the system automatically displays the Field Service Manager page. Click the Service Team Cost Performance task on the springboard to access the Service Team Cost Performance page.
This graphic illustrates the Service Team Cost Performance page:
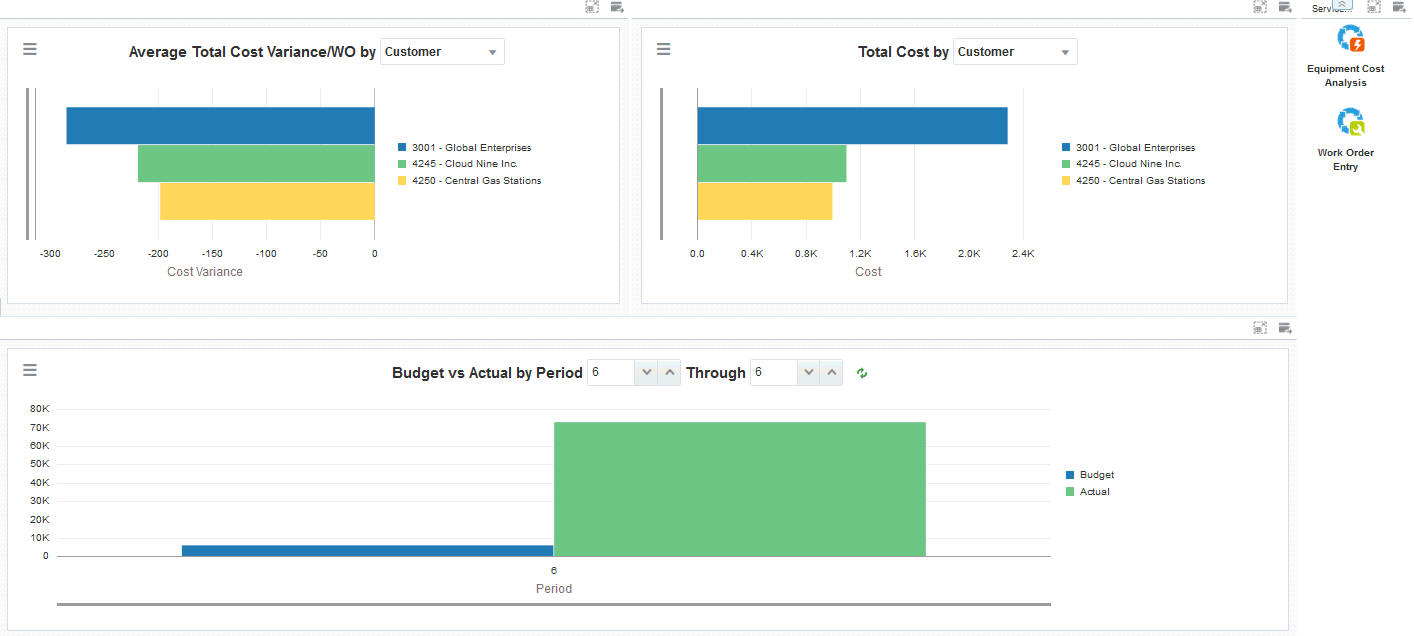
Charts
These charts are based on EnterpriseOne programs. By default, the charts are set up to render using queries that are based on delivered demo data. Each of these queries is associated with a specific program version. To use a different query or call a different program version, you can modify these queries or create new queries that better meet your requirements.
This table lists and describes the charts that are available on the Service Team Cost Performance page:
Component Title |
Description |
|---|---|
Average Hours Variance/WO by (P13560X/W13560XO) |
Use this chart to view the average actual hours variance by work order for your team. This chart is based on the One View Service Work Order Analysis Inquiry program (P13560). Additionally, you can use the drop-down menu on the top of the chart to change the data that the system displays. You can select one of these options:
|
Total Cost by (P13560X/W13560XG) |
Use this chart to view work order total cost by contract for your team. This chart is based on the One View Service Work Order Analysis Inquiry program (P13560). Additionally, you can use the drop-down menu on the top of the chart to change the data that the system displays. You can select one of these options:
|
Budget vs Actual by Period (P09217X/W09217XB) |
Use this chart to view budget amounts versus actual amounts by period for your team. This chart is based on the One View Account Balance Inquiry program (P09217, version ZJDE0002). You can use the fields at the top of the chart to specify which periods to include in the chart. |
For additional information about the programs associated with these charts, see these topics in the JD Edwards EnterpriseOne Applications One View Reporting User Guide:
Springboard Tasks
You use tasks to access EnterpriseOne programs and other UX One pages. These tasks are included in a springboard on the page.
This table lists and describes the tasks on the Service Team Cost Performance page:
Task |
Description |
|---|---|
Equipment Cost Analysis |
Use this task to access the Equipment Cost Analysis program (P13801). The following form layouts are available:
The following grid formats are available:
|
Work Order Entry |
Use this task to access the Work Order Entry program (P48201) The following form layouts are available:
The following grid formats are available:
|
For additional information about the programs accessed by these tasks, see:
Setting Up Equipment Cost Analysis in the JD Edwards EnterpriseOne Applications Equipment Cost Analysis Implementation Guide
Creating Work Orders Using the Work Order Entry Programs (P48201/P17714) in the JD Edwards EnterpriseOne Applications Service Management Implementation Guide