Create Pull Sequences for an Item and Point of Use with Different Source Types
You can now create pull sequences with difference source types, such as Supplier, Inter Org, Intra Org, and Production for the same item and point-of-use combination. You can also create pull sequences with the same Item, Point of Use, and Source type but with a different source.
Prior to Release 12.2.15, you could define a pull sequence for an Item and Point of Use combination with only a single source type.
In the Kanban Setup page, you can create pull sequences with the same Item, Point of Use with different source types and sources as highlighted in the screenshot below.
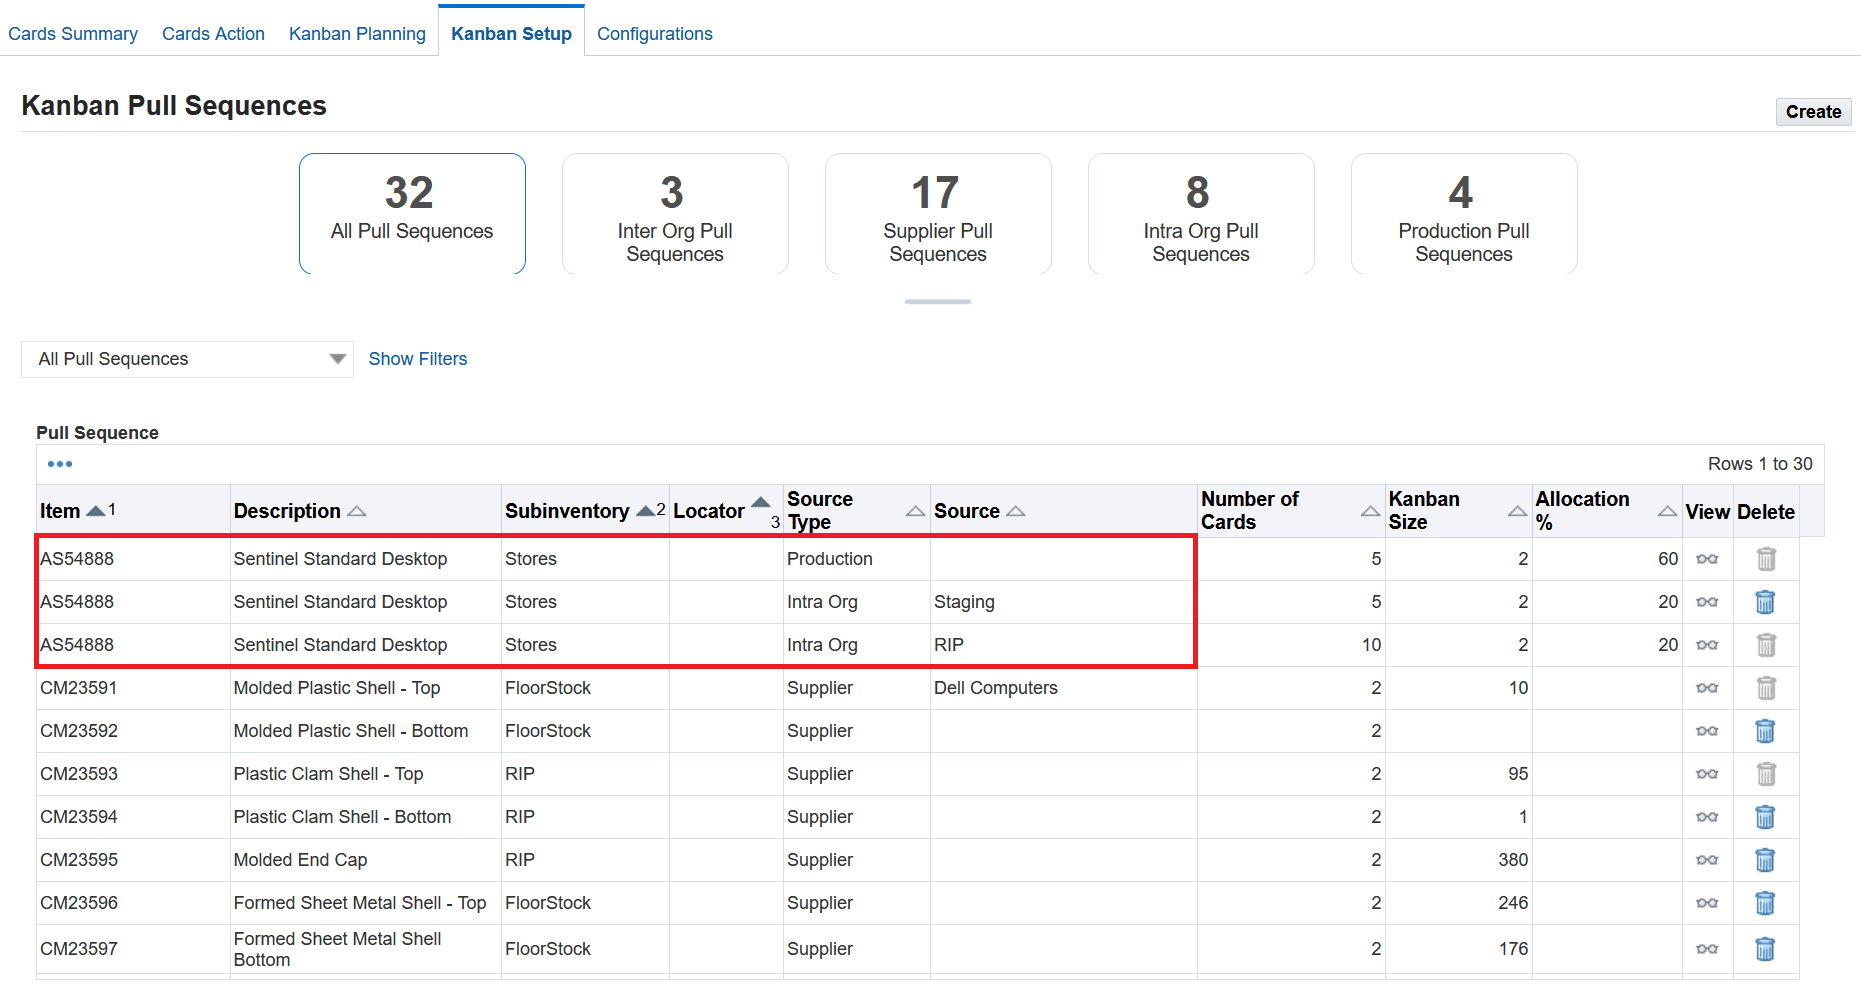
Kanban Setup - Pull Sequences with different source types and sources
In the pull sequence definition, you can enter the Allocation % for the pull sequence. You can click on the tool tip icon to view the list of pull sequences with the same Item and Point of Use and their Allocation % across different sources. A warning message is displayed in case the sum of Allocation % for an item and point of use across different sources is greater than 100.
Note that the pull sequences with items directly included in the forecast that are not generated through BOM will be equally distributed among the pull sequences with same the Item and Point of Use if the Allocation % is not defined.
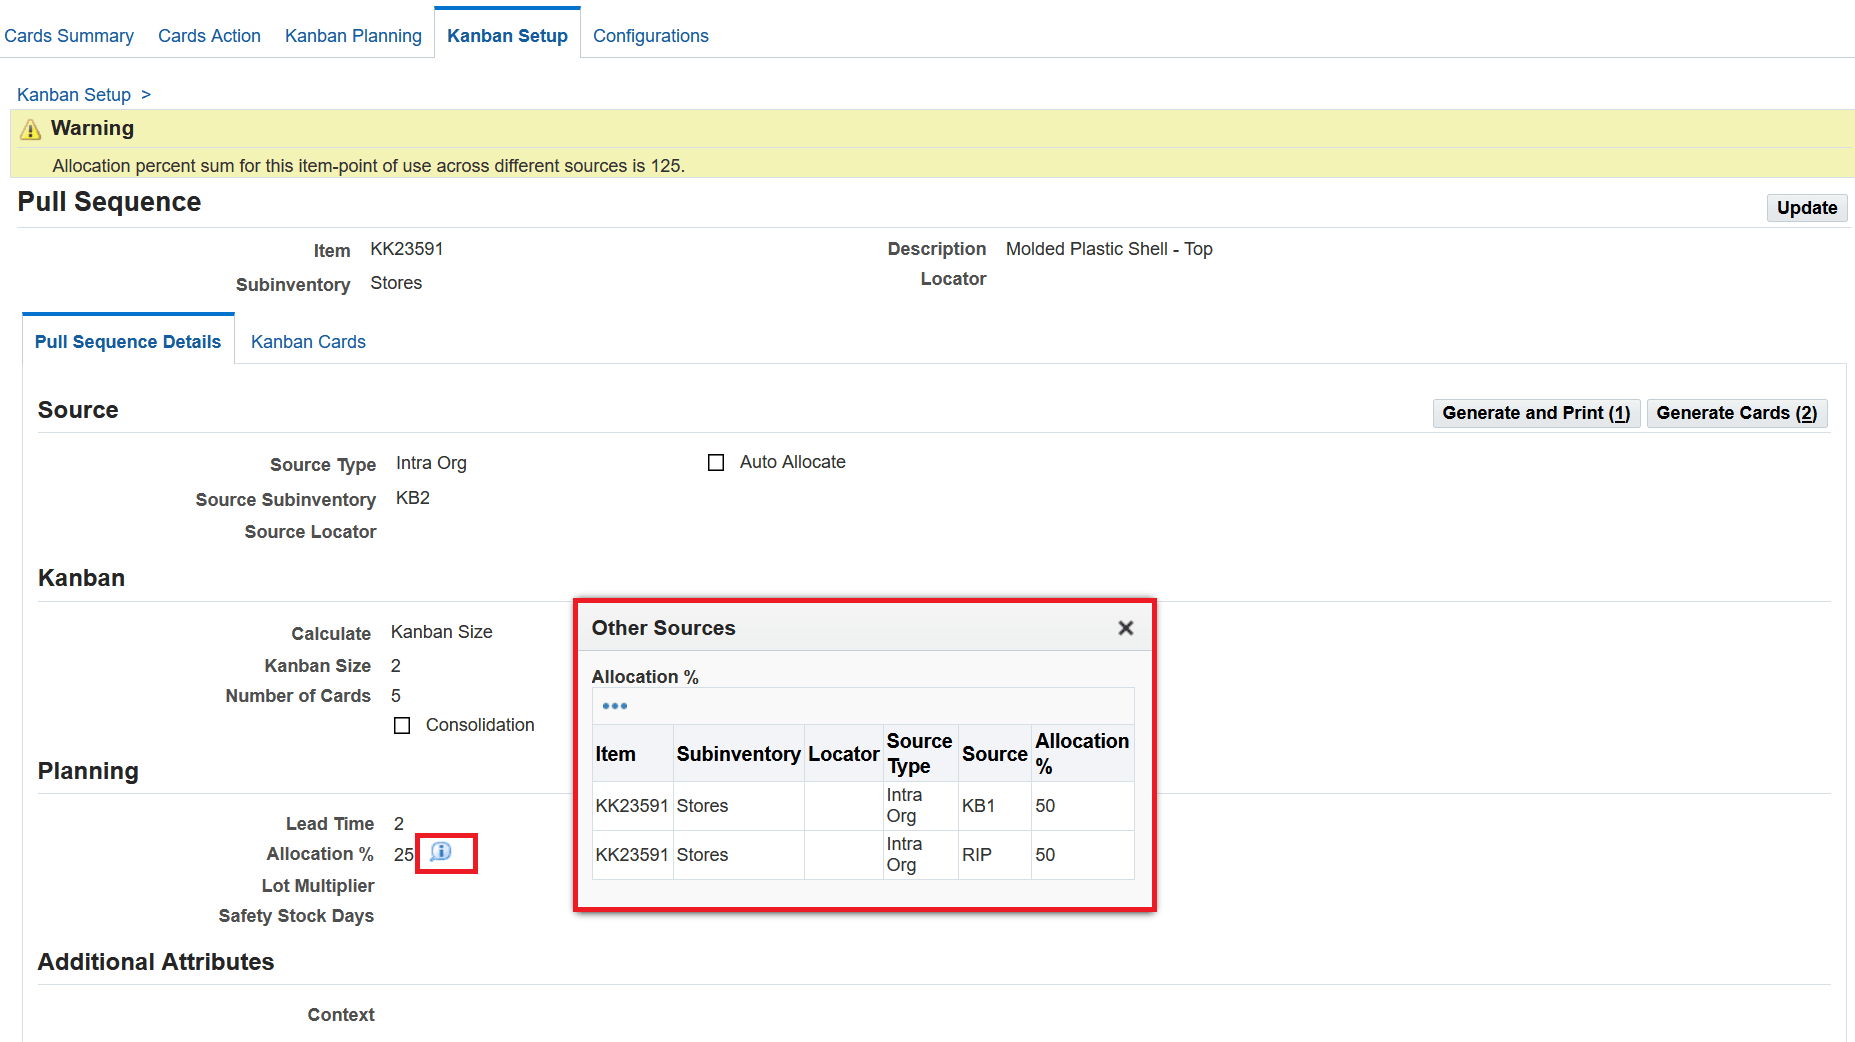
Pull Sequence definition - View Allocation % of other sources
In the Kanban Setup page, Source and Allocation % attributes are hidden by default and can be personalized to be displayed in the Pull Sequence table.
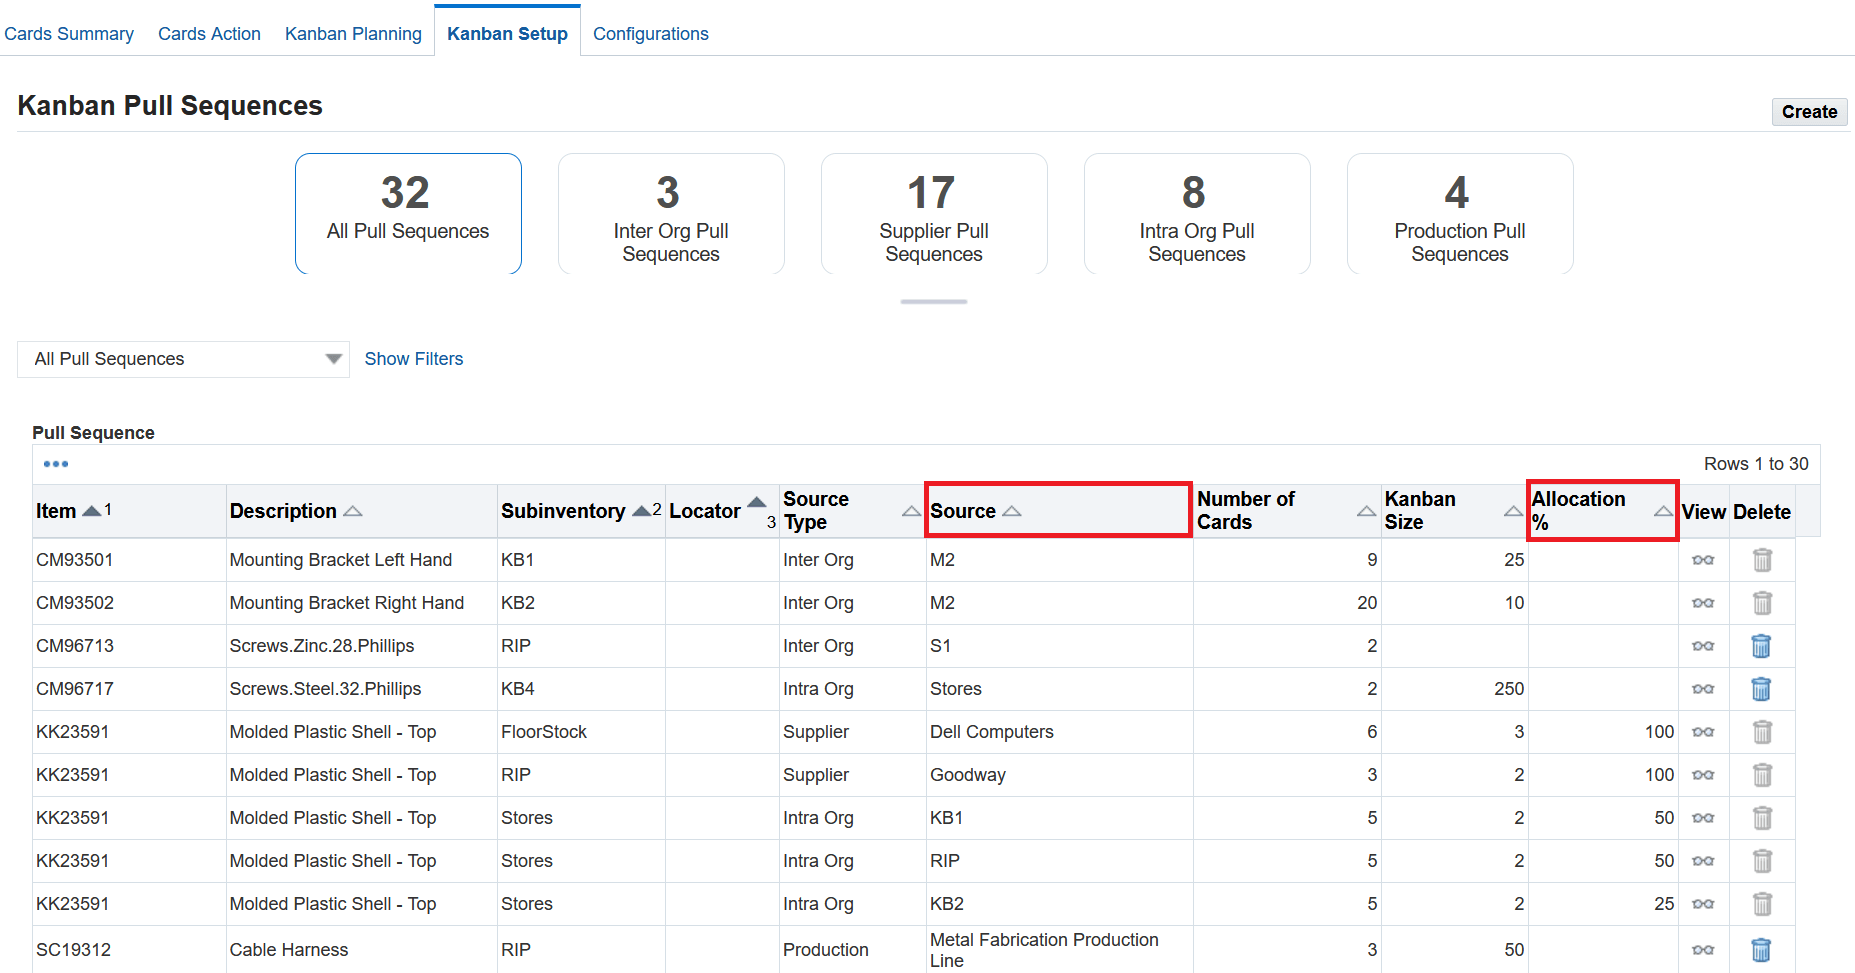
Kanban Setup - Personalize Source and Allocation % columns
Additionally, the "Is Allocation % Defined" filter in Kanban Setup enables you to filter pull sequences that have the Allocation % defined.
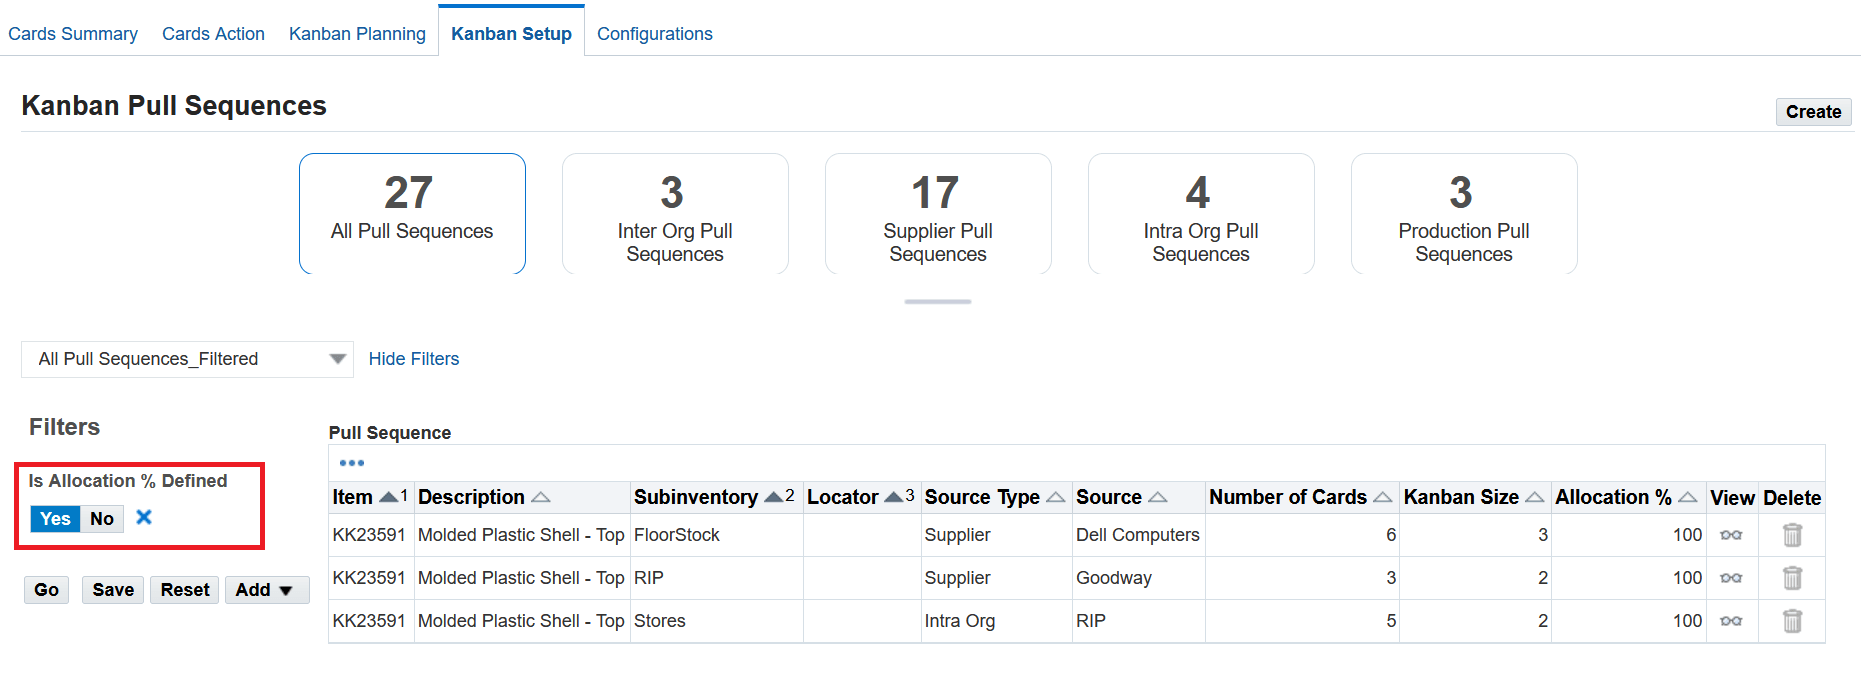
Kanban Setup - Filter pull sequences based on Allocation % defined
In the Planning Workbench tab, Source, Source Type and Current Allocation % are displayed in the planning details pane. Kanban planning uses the Allocation % to consider pull sequences defined for the Item and Point of Use across source types and calculates the average demand, Kanban size, and number of cards.
The Source Type and Source attributes are hidden by default and can be personalized to be displayed in the Pull Sequence Planning table.
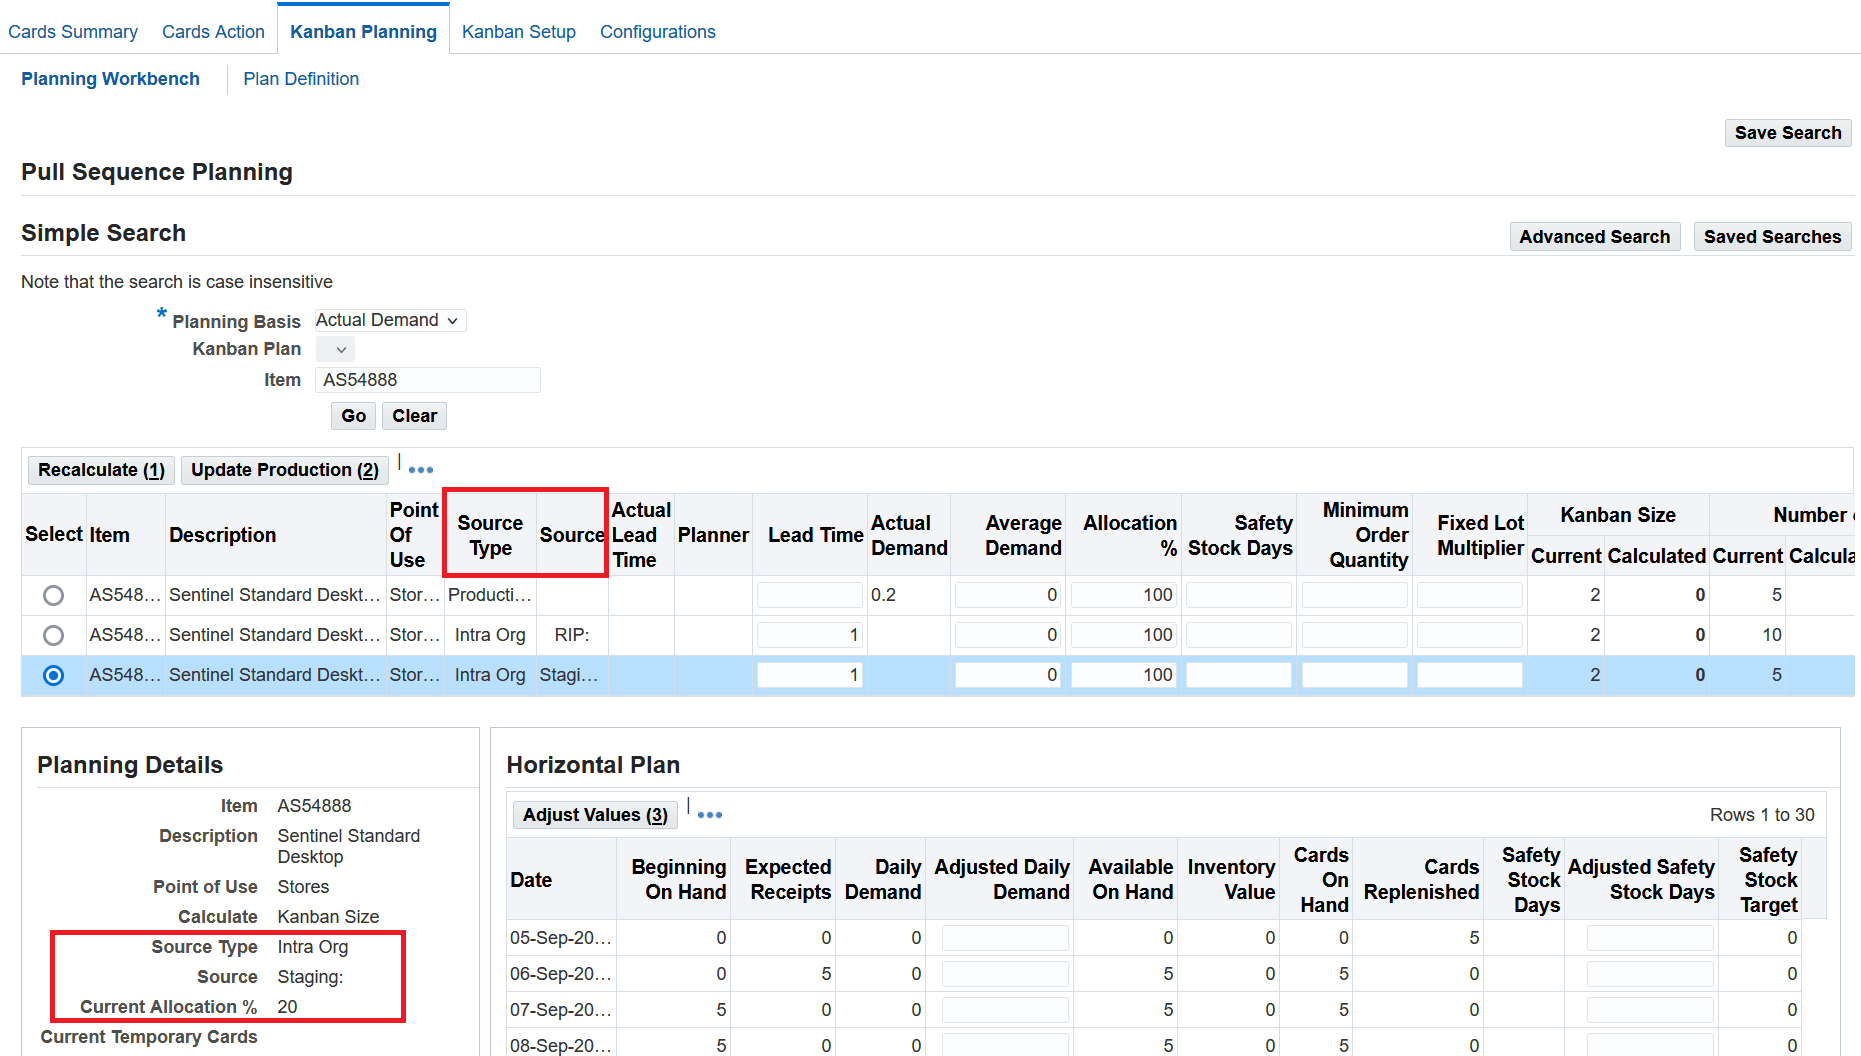
Planning Workbench
Kanban planning is accurate when the total Allocation % is 100 across all the pull sequences defined for the same Item and Point of Use.
Allocation % is derived when the Allocation % is blank in the pull sequence definition. When the Allocation % is blank, the allocation is evenly distributed across all the pull sequences defined for the same Item and Point of Use such that the total Allocation % is 100.
In the following example, you can see the details of pull sequence and the planning Allocation %. The table displays the details in the following order:
- Item
- Point of Use
- Source
- Current Allocation% defined
- Derived Allocation %
The derived Allocation% result is highlighted.
| Use Case |
BOM definition Profile Option: |
BOM definition Profile Option: |
|---|---|---|
| The total of Allocation % is less than 100% with few pull sequences having blank Allocation %. | Item – Stores1 – RIP1 – 70 – 70 Item – Stores1 – RIP2 – Blank – 15 Item – Stores1 – RIP3 – Blank – 15 |
Item – Stores1 – RIP1 – 70 – 70 Item – Stores2 – RIP1 – Blank – 10 |
| Allocation % is not defined in all the pull sequences. | Item – Stores1 – RIP1 – Blank – 50 Item – Stores1 – RIP2 – Blank – 50 |
Item – Stores1 – RIP1 – Blank – 25 Item – Stores2 – RIP1 – Blank – 25 |
| Allocation % is defined in every pull sequences but the total Allocation % exceeds 100. | Item – Stores1 – RIP1 – 50 – 50 Item – Stores1 – RIP2 – 50 – 50 Item – Stores1 – RIP3 – 50 – 50 |
Item – Stores1 – RIP1 – 50 – 50 Item – Stores2 – RIP1 – 50 – 50 |
| Allocation % is defined in every pull sequences but the total Allocation % is less than 100. | Item – Stores1 – RIP1 – 20 – 20 Item – Stores1 – RIP2 – 20 – 20 Item – Stores1 – RIP3 – 20 – 20 |
Item – Stores1 – RIP1 – 20 – 20 Item – Stores2 – RIP1 – 20 – 20 |
| Allocation % is not defined in some pull sequences and the total Allocation % of other pull sequences already exceeds 100. | Item – Stores1 – RIP1 – 60 – 60 Item – Stores1 – RIP2 – 60 – 60 Item – Stores1 – RIP3 – Blank – 0 |
Item – Stores1 – RIP1 – 50 – 50 Item – Stores2 – RIP1 – 50 – 50 |
On the Cards Summary page, click Multiple in the Source column, as shown in the screenshot below, to open the Cards Summary by Source pop-up window and view the cards summary for different sources.
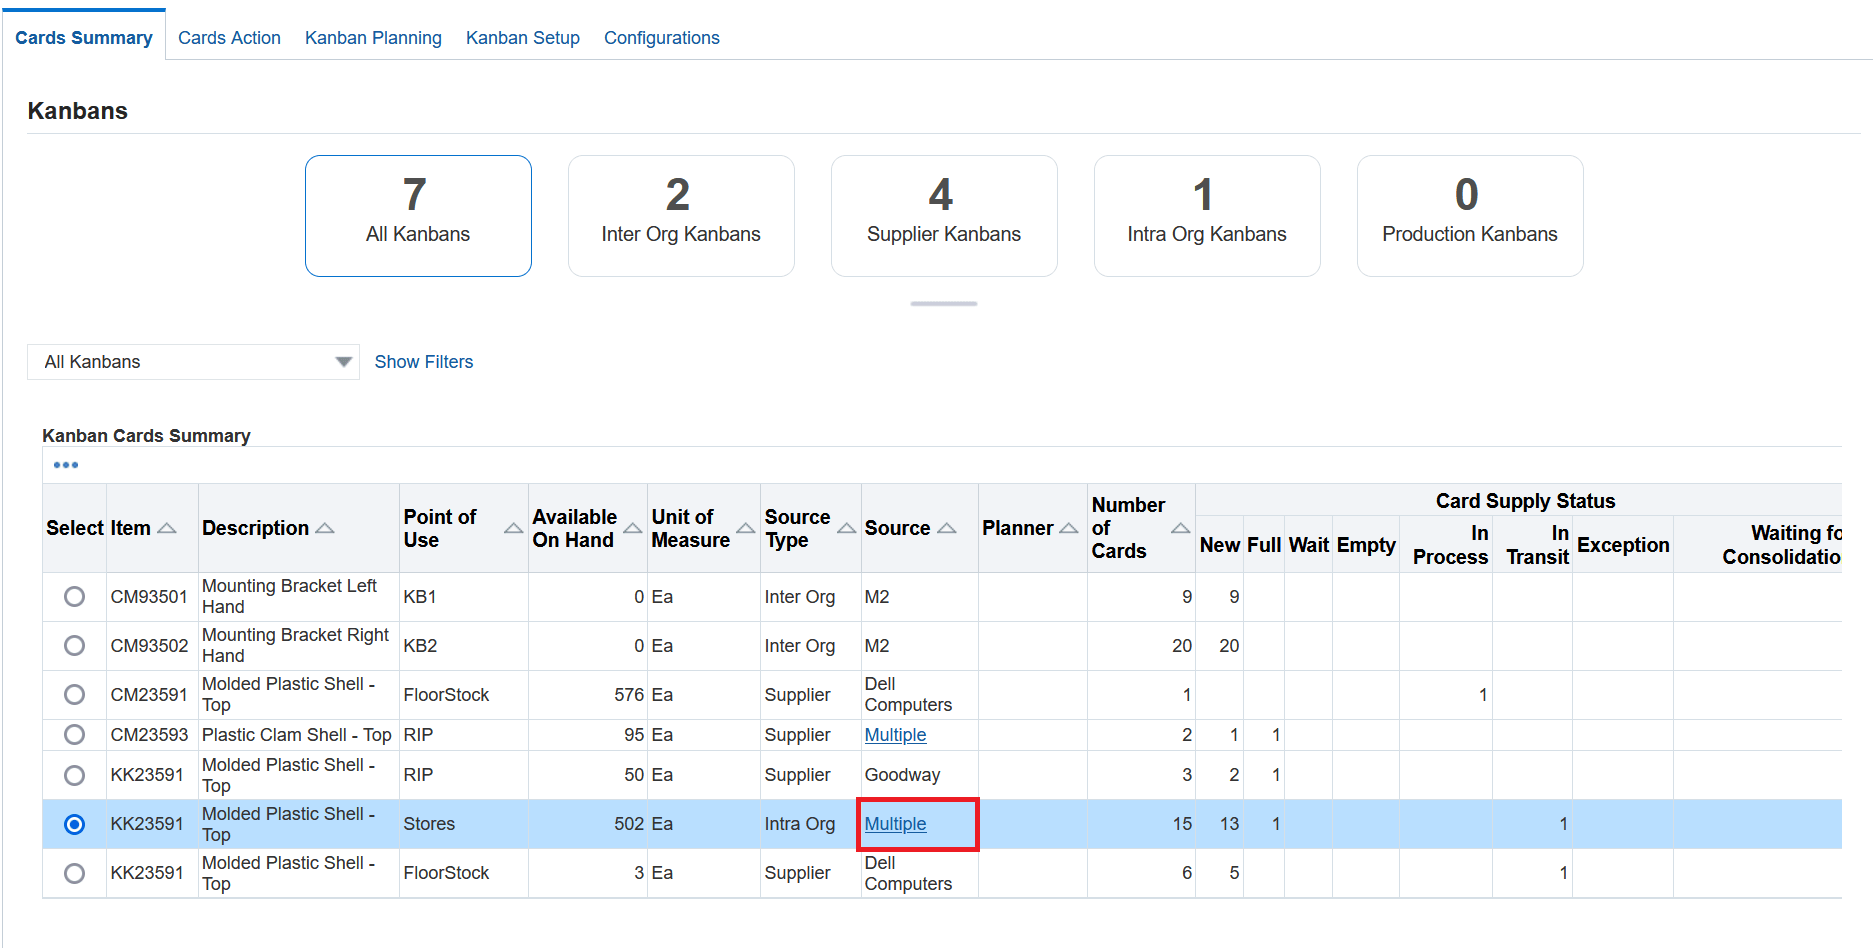
Cards Summary
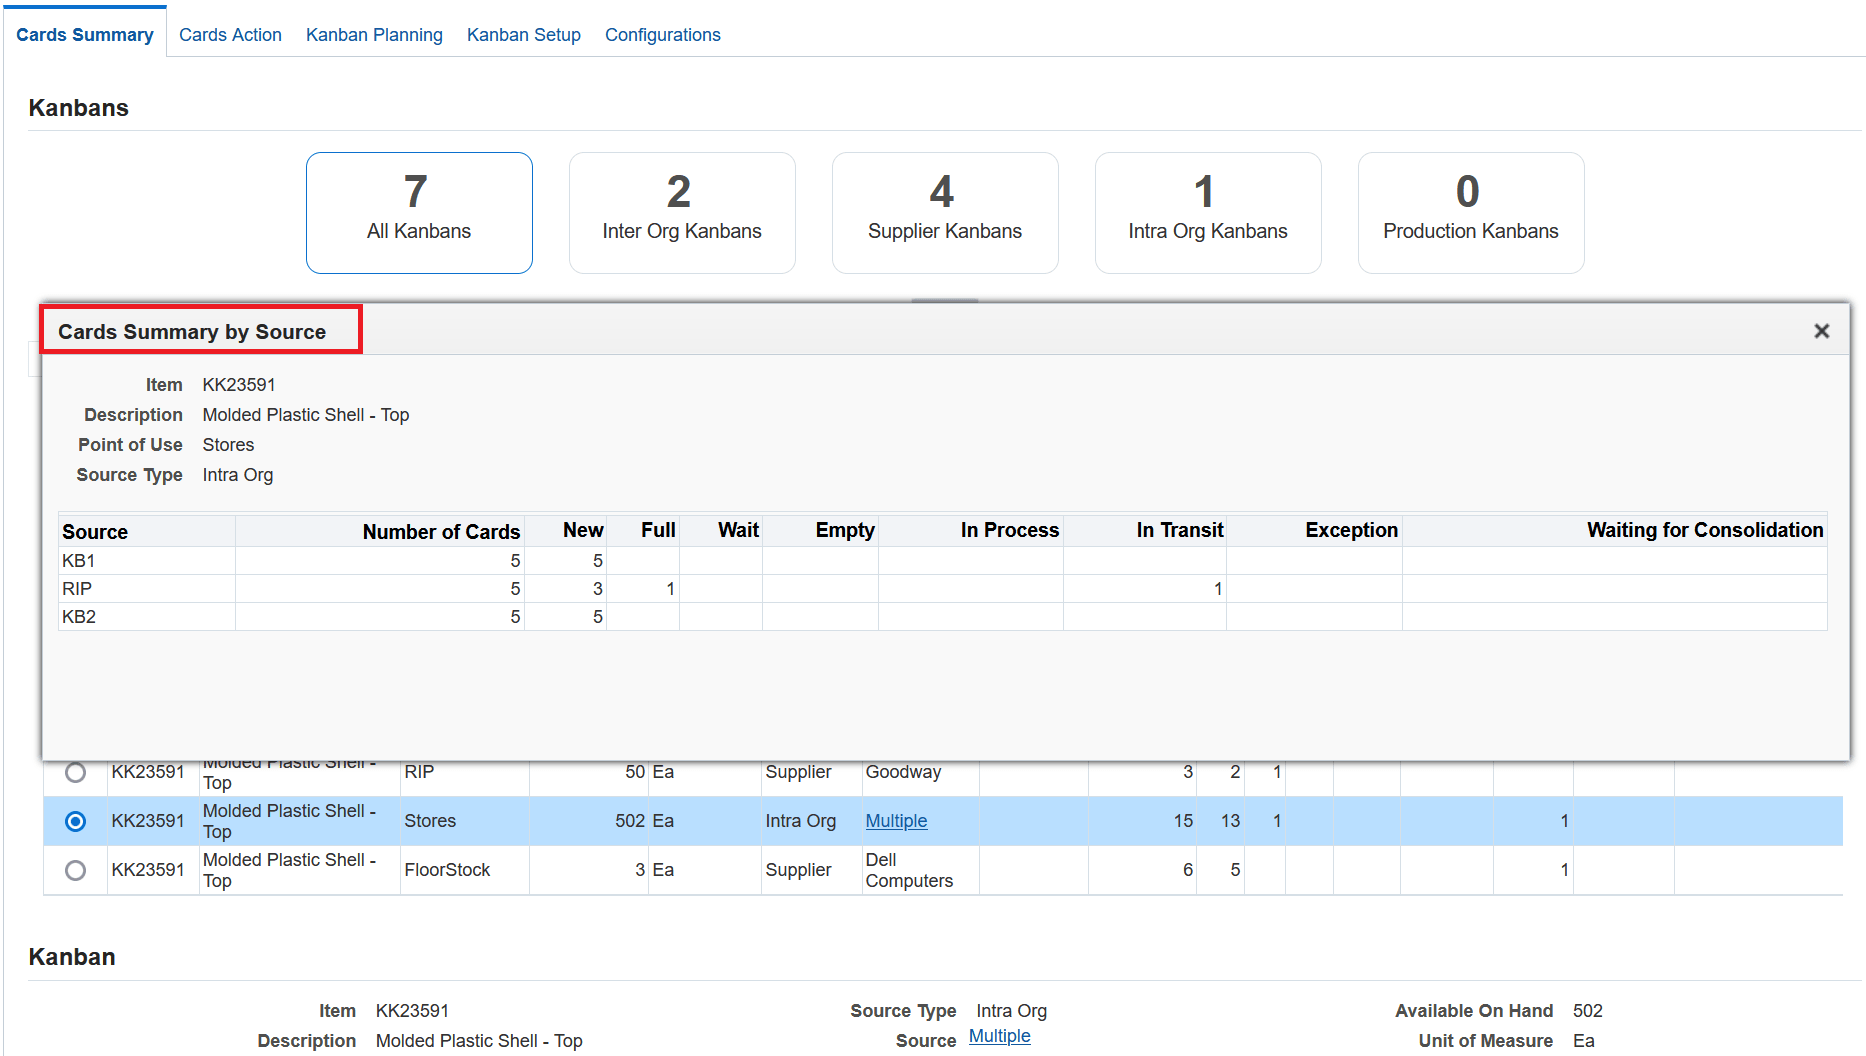
Cards Summary by Source pop-up window
You can use the interface table to upload pull sequence details with different source types, sources, and Kanban card details. Run the eKanban Import Pull Sequence and Kanban Cards concurrent program to upload the data into eKanban.
Steps to Enable
| Profile Option | Description |
|---|---|
| FLM: Consider Non Matching Subinv Demand | Set the profile option to Yes to calculate and distribute demand for pull sequences that do not have matching BOM subinventories and that have allocation percentage that is not equal to 100. |
Key Resources
- Oracle E-Business Suite News and Information: oracle.com/ebs
- Oracle E-Business Suite Product Documentation: https://docs.oracle.com/cd/E26401_01/index.htm
- Oracle University: https://www.oracle.com/education
- Oracle Support: https://www.oracle.com/support