Reporting and Analysis in Excel
You can view Reports and Analytic Views or visualizing data for analysis purpose using the Analysis and Reports menu.
Note
This menu is unavailable if you install Oracle Autonomous Database for Excel using Microsoft Store.
This menu is unavailable if you install Oracle Autonomous Database for Excel using Microsoft Store.
The reports and charts can be viewed in of different range of charts, namely, Bar Chart, Area Chart, Line Chart and Pie Chart. The Analyses and Reports icon enables you to retrieve Analyses and Reports from the Autonomous Database.
View Analysis
To view Analysis and explore the Analyses and Reports menu:
- On the MS Excel ribbon, select the Analyses and Reports icon from the Autonomous Database menu.
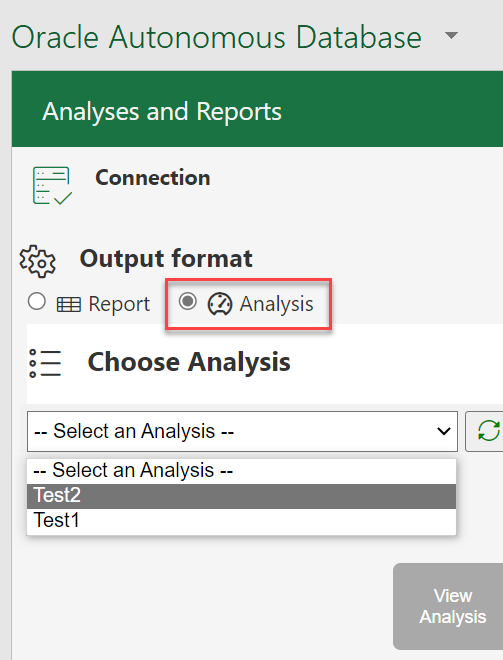
- Select Analysis under Output format.

Description of the illustration analyses-add.png - Use the Select an Analysis drop down to choose the Analysis you want to view.
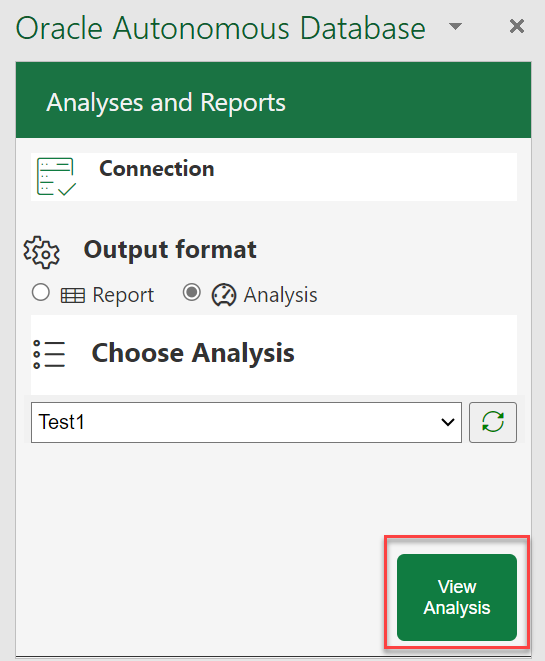
- Click View Analysis to view analysis in a new excel sheet.

Description of the illustration view-analyses.png
View Report
To view Reports :
- On the MS Excel ribbon, select the Analyses and Reports icon from the Autonomous Database menu.
- Select Report under Output Format.

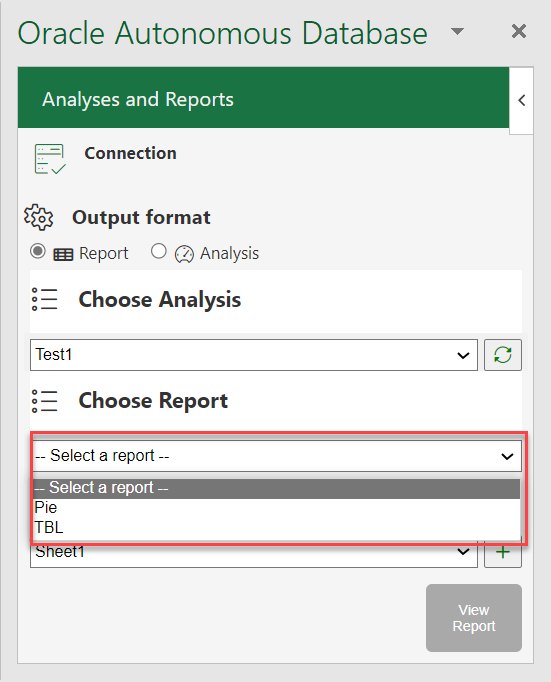
Description of the illustration select-report-dropdown.png - Use Select an Analysis drop down under Choose Analysis to choose the Analysis you want to view.
- After you select the Analysis, to view the report present in the Analysis, click the Select a report drop-down and select the report you wish to view.

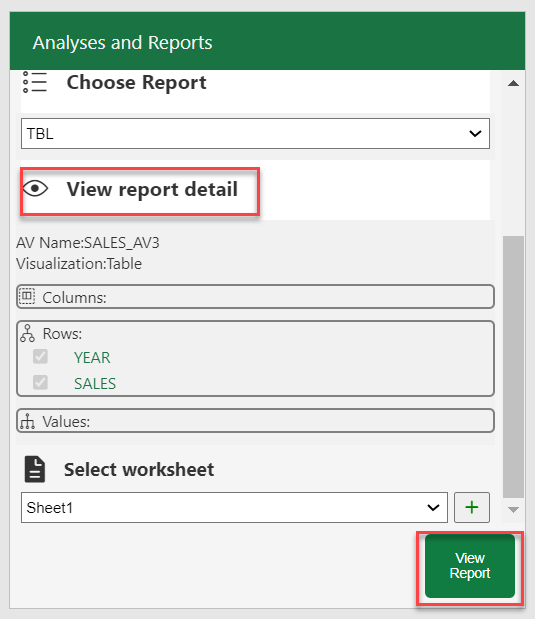
Description of the illustration select-report-dropdown.png - Click View Report Detail to view more information about the report namely, Analytic View Name, Type of visualization and rows, columns or values you select while creating the report.

Description of the illustration view-report.png - Select the worksheet from the drop-down where you would want to view the report.
- Click View Report to view the report in the sheet you select from the previous step.
You can now view the report in the worksheet you select.
Parent topic: Oracle Autonomous Database for Excel