49 Execution Tracing
This chapter describes how to enable and use execution tracing for services in the Oracle Service Bus Administration Console.
Oracle Service Bus lets you trace messages without having to shut down the server. This feature is useful in both a development and production environments. Execution tracing allows administrators, support engineers, and systems engineers to troubleshoot and diagnose a message flow in one or more proxy services.
For example, if one of your proxy services is failing and you want to find out at which stage the problem exists, you can enable execution tracing for that proxy service. After tracing is enabled, the system logs various details extracted from the message flow such as stage name, name of the pipeline, and route node name.
The entire message context is also printed, including headers and message body. When a fault occurs in the message flow, additional details such as error code and reason are logged. Execution tracing occurs at the beginning and end of each component in the message flow, which includes stages, pipelines, and nodes. Actions are not traced individually.
49.1 How to Enable or Disable Execution Tracing
You can enable execution tracing from View a Proxy Service page of the Oracle Service Bus Administration Console.
Note:
To see tracing in the log file or standard out (server console), Oracle WebLogic Server logging must be set to the following severity levels:-
Minimum severity to log: Info
-
Log file: Info
-
Standard out: Info
For information on setting log severity levels, see "Using Log Severity Levels" in Oracle Fusion Middleware Configuring Log Files and Filtering Log Messages for Oracle WebLogic Server.
To configure execution tracing:
-
Select the proxy service you want. For more information on how to find a proxy service, see Section 27.1.2, "Finding Proxy Services."
-
On the Operational Settings tab, select the Enabled option for Execution Tracing.
Note:
To enable execution tracing for all proxy services, use Smart Search to find all proxy services. With all proxy services displayed, select the Exe. Tracing option at the top of the table. -
Click Update and activate the session.
You can view the execution tracing status for a proxy service in the Operation Settings tab of the View a Proxy Service page, Summary of All Services table, and Summary of Proxy Services table. For more information about Summary of All Services, see Section 51.3, "Managing Operational Settings for All Services," and for more information about Summary of Proxy Services, see Section 51.4, "Managing Operational Settings for Proxy Services."
49.2 How to Access Tracing Information
The tracing information is stored in the server directory logs at the following location:
DOMAIN_HOME/domain/servers/server_name/logs/server_name.log
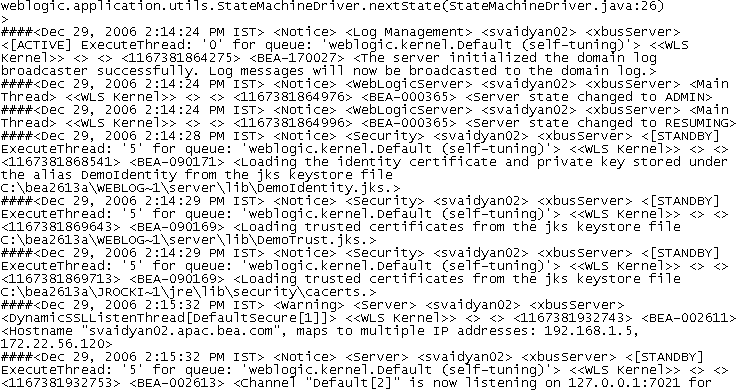
Figure 49-1 shows a sample of the tracing log.
Note:
The execution tracing pattern in the server log is identical to the execution tracing in the Test Console. For more information on tracing in the Test Console, see Section 33.1.4, "Tracing Proxy Services."