18 Managing Multi-Server Domains
This section contains the typical multi-server domain tasks you can perform with Oracle CEP Visualizer, including:
For more information, see:
18.1 Managing Cluster Groups and Topologies
This section describes:
18.1.1 How to View Cluster Group Membership
You can view the default and user-defined cluster groups, what servers belong to those groups, and what applications are deployed to those groups.
By default, there is a group for each server with the same name as the server and a group named AllDomainMembers which represents all the servers in the domain. In addition, you can define custom groups when you configure your cluster.
You may deploy an application to a cluster group or to an individual server. When you deploy to a cluster group, the application belongs to the group, not the individual servers in the group. When you deploy to an individual server, the application belongs to the server's own group.
For more information, see
-
Section 5.1.2, "How to Deploy an Application in a Multi-Server Domain"
-
"Groups" in the Oracle Complex Event Processing Administrator's Guide
To view cluster group membership:
-
In the left pane, click the Domain node, where Domain refers to the name of your Oracle CEP domain.
-
In the right pane, click the Cluster Groups/Server tab.
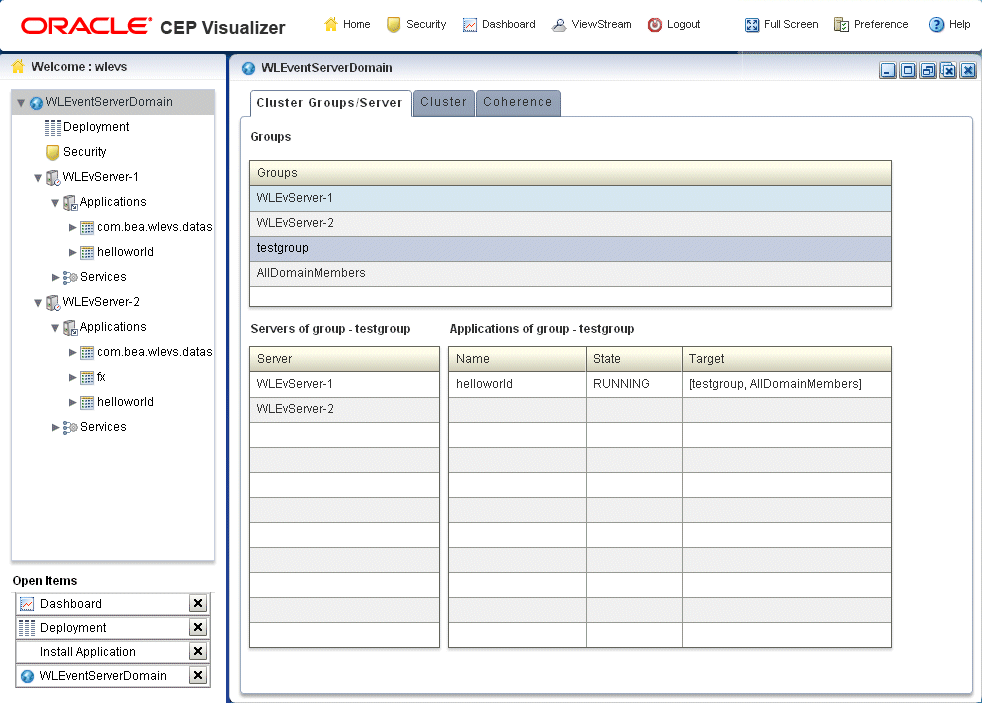
The Cluster Groups/Server tab appears as Figure 18-1 shows.
-
Use the Cluster Groups/Server tab to examine the server and application contents of various cluster groups.
For example:
-
Group
testgroupcontains two servers (WLEvServer-1andWLEvServer-2) and one application (helloworld) as Figure 18-1 shows. -
Group
WLEvServer-1contains one server (WLEvServer-1) and no applications. Thehelloworldapplication listed under itsApplicationsnode belongs to grouptestgroup, not to serverWLEvServer-1. -
Group
WLEvServer-2contains one server (WLEvServer-2) and one application (fx). Thefxapplication was deployed to serverWLEvServer-2. Thehelloworldapplication listed under itsApplicationsnode belongs to grouptestgroup, not to serverWLEvServer-2.
-
18.1.2 How to View all Cluster Topologies
Using Oracle CEP Visualizer, you can view all cluster topologies regardless of cluster implementation. You can also view cluster group properties and server instance properties.
If you deploy an Oracle CEP high availability application, you can view the Oracle CEP high availability topology. For more information, see Section 18.1.3, "How to View Oracle CEP High Availability Cluster Topologies".
If you are using Oracle Coherence for clustering, you can view Oracle Coherence topology. For more information, see Section 18.2.1, "How to View Oracle Coherence Cluster Topologies".
To view all cluster topologies:
-
In the left pane, click the Domain node, where Domain refers to the name of your Oracle CEP domain.
-
In the right pane, click the Cluster tab.
-
In the right pane, click the Topology tab.
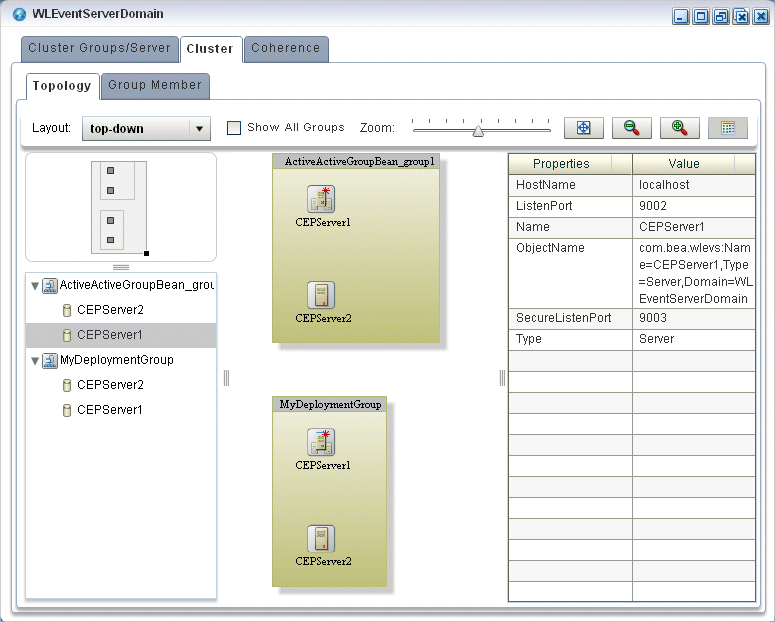
The Topology tab appears as Figure 18-2 shows.
This tab shows all cluster groups regardless of the cluster implementation.
Within a cluster group, the primary server is identified by the icon that Figure 18-3 shows. In Figure 18-2, the primary server is
CEPServer1.For information on the various tools along the top of the topology canvas, see Section 18.3, "Managing the Cluster Topology Diagram".
-
To view the properties for a given group, click on the group in the Group List.
-
To view the properties for a given server instance, click on the server instance in the Group List.
-
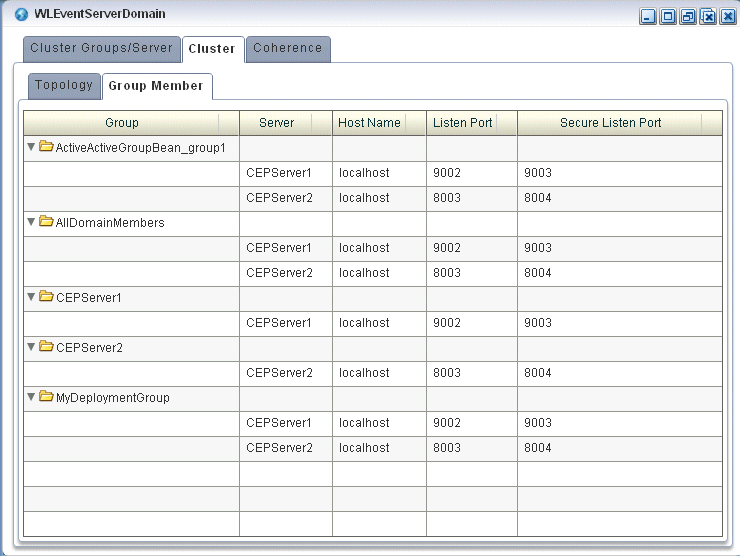
To view details on a given server instance, click the Group Member tab and select the server instance as Figure 18-4 shows.
-
Use the Group Member tab to customize the group table:
-
To change the order of columns, click on the column name in the cache chart and drag left or right.
-
To change the sort order of a column, click the triangle to the right of the column name in the cache chart.
-
18.1.3 How to View Oracle CEP High Availability Cluster Topologies
Using Oracle CEP Visualizer, you can view an Oracle high availability cluster topology. You can also view cluster group properties and server instance properties.
For more information, see "Understanding High Availability" in the Oracle Complex Event Processing Developer's Guide for Eclipse.
To view Oracle CEP high availability cluster topologies:
-
In the left pane, click the Domain node, where Domain refers to the name of your Oracle CEP domain.
-
In the right pane, click the Cluster tab.
-
In the right pane, click the Topology tab.
For an Oracle CEP high availability application, you can use the Topology tab to:
-
Visualize a high-availability configuration.
See Section 18.1.3.1, "Visualizing an Oracle High Availability Configuration"
-
Visualizer a high-availability and scalability configuration.
See Section 18.1.3.2, "Visualizing an Oracle High Availability and Scalability Configuration".
For information on the various tools along the top of the topology canvas, see Section 18.3, "Managing the Cluster Topology Diagram".
-
-
To view the properties for a given group, click on the group in the Group List.
-
To view the properties for a given server instance, click on the server instance in the Group List.
-
To view details on a given server instance, click the Group Member tab and select the group and server instance as Figure 18-5 shows.
-
Use the Group Member tab to customize the group table:
-
To change the order of columns, click on the column name in the cache chart and drag left or right.
-
To change the sort order of a column, click the triangle to the right of the column name in the cache chart.
-
18.1.3.1 Visualizing an Oracle High Availability Configuration
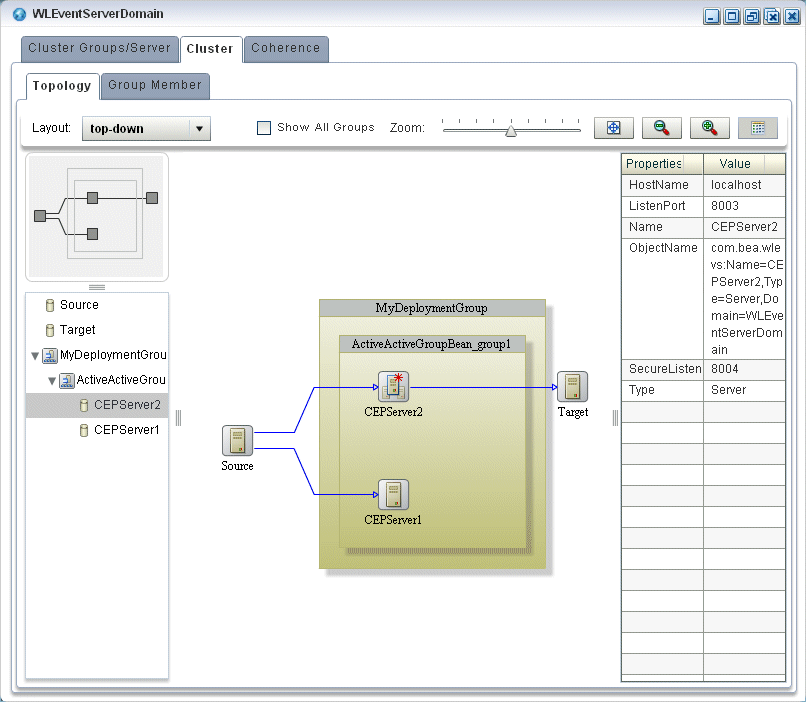
For an Oracle CEP high availability application, the Topology tab shows the notification group nested within the deployment group.
In Figure 18-6, the deployment group is MyDeploymentGroup and the notification group is ActiveActiveGroupBean_group1.
Figure 18-6 Cluster Topology Tab: Oracle CEP High Availability
Description of "Figure 18-6 Cluster Topology Tab: Oracle CEP High Availability"
The primary server is identified by the icon that Figure 18-7 shows. In Figure 18-6, the primary server is CEPServer2.
The stream data source inputs to both primary and secondary servers but only the primary server outputs events. If CEPServer2 goes down, an Oracle high availability failover occurs and CEPServer1 resumes outputting events as the new primary for ActiveActiveGroupBean_group1. When CEPServer2 is brought back online, it rejoins ActiveActiveGroupBean_group1 as a secondary server.
For information on the various tools along the top of the topology canvas, see Section 18.3, "Managing the Cluster Topology Diagram".
For more information, see:
-
"Understanding High Availability" in the Oracle Complex Event Processing Developer's Guide for Eclipse
-
"Deployment Group and Notification Group" in the Oracle Complex Event Processing Developer's Guide for Eclipse
18.1.3.2 Visualizing an Oracle High Availability and Scalability Configuration
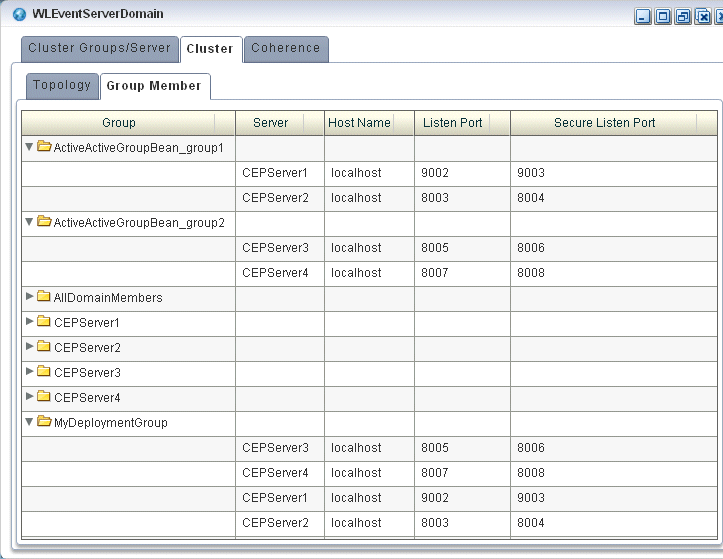
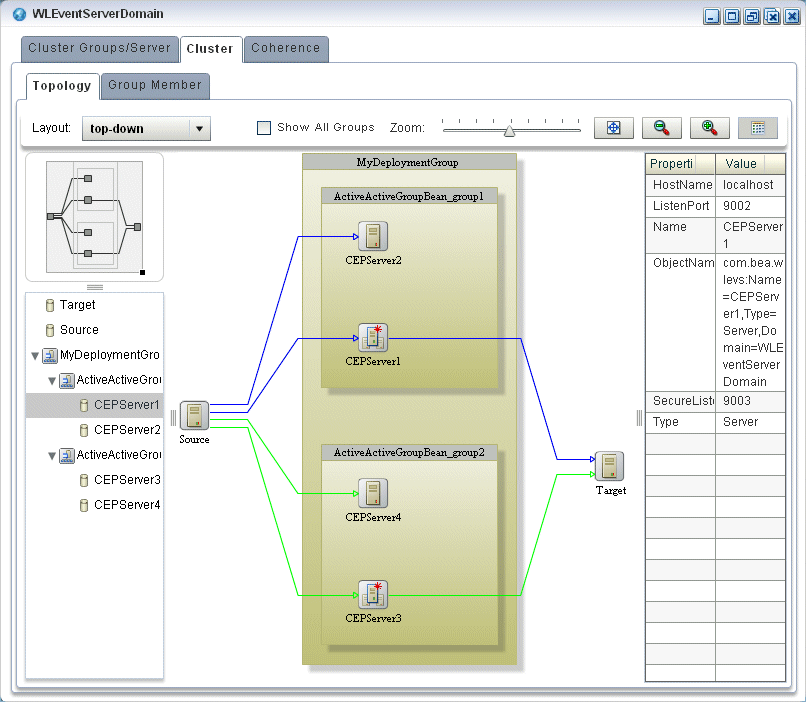
If your Oracle CEP high availability application combines high availability and scalability, then the Topology tab shows notification groups nested within the deployment group.
In Figure 18-8, the deployment group is MyDeploymentGroup and the notification groups are ActiveActiveGroupBean_group1 and ActiveActiveGroupBean_group2.
Figure 18-8 Cluster Topology Tab: Oracle CEP High Availability and Scalability
Description of "Figure 18-8 Cluster Topology Tab: Oracle CEP High Availability and Scalability"
The primary server is identified by the icon that Figure 18-9 shows. In Figure 18-8, the primary server of notification group ActiveActiveGroupBean_group1 is CEPServer1 and the primary server of notification group ActiveActiveGroupBean_group2 is CEPServer3.
The stream data source inputs to both primary and secondary servers in each notification group but only the primary server in each notification group outputs events. The stream data source is partitioned (by JMS selector) so that each notification group processes a different subset of the input data. The Oracle CEP Visualizer indicates this with a different colored line for each notification group. For example, ActiveActiveGroupBean_group1 may process events with accountID <= 500 and ActiveActiveGroupBean_group2 may process events with accountID > 500. Both CEPServer1 and CEPServer2 process events with accountID <= 500 in parallel and CEPServer3 and CEPServer4 process events with accountID > 500 in parallel. If CEPServer1 goes down, an Oracle high availability failover occurs and CEPServer2 resumes outputting events as the new primary for ActiveActiveGroupBean_group1. When CEPServer1 is brought back online, it rejoins ActiveActiveGroupBean_group1 as a secondary server.
For information on the various tools along the top of the topology canvas, see Section 18.3, "Managing the Cluster Topology Diagram".
For more information, see:
-
"High Availability and Scalability" in the Oracle Complex Event Processing Developer's Guide for Eclipse
-
"Deployment Group and Notification Group" in the Oracle Complex Event Processing Developer's Guide for Eclipse
18.2 Managing Oracle Coherence
This section includes the following topics:
-
Section 18.2.1, "How to View Oracle Coherence Cluster Topologies"
-
Section 18.2.2, "How to Monitor Nodes in an Oracle Coherence Cluster"
18.2.1 How to View Oracle Coherence Cluster Topologies
Using Oracle CEP Visualizer, if you are using Oracle Coherence clustering, you can view Oracle Coherence cluster topologies, cluster group properties, and server instance properties.
To view all clustering topologies regardless of clustering implementation, see Section 18.1.2, "How to View all Cluster Topologies".
To view Oracle Coherence cluster topologies:
-
In the left pane, click the Domain node, where Domain refers to the name of your Oracle CEP domain.
-
In the right pane, click the Coherence tab.
-
In the right pane, click the Topology tab.
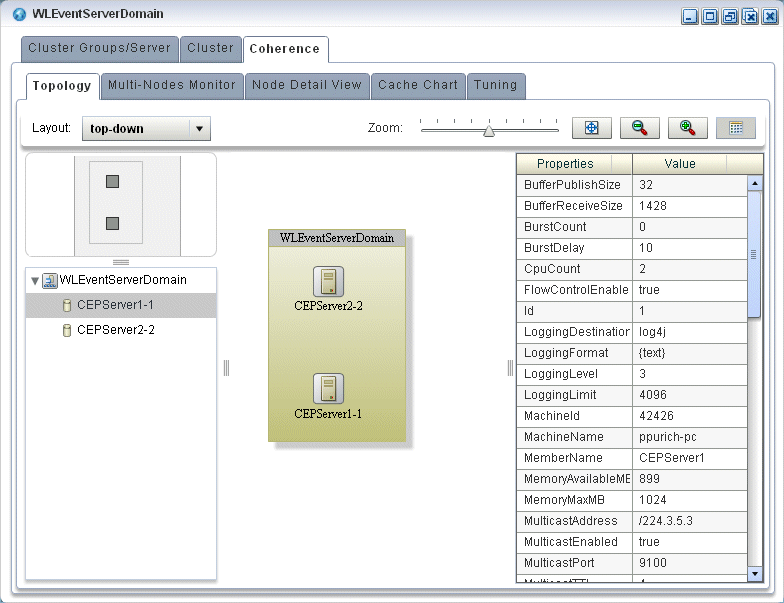
The Topology tab appears as Figure 18-10 shows.
Figure 18-10 Oracle Coherence Cluster Topology Tab
Description of "Figure 18-10 Oracle Coherence Cluster Topology Tab"
This tab shows all cluster groups that the Oracle Coherence clustering implementation manages.
For information on the various tools along the top of the topology canvas, see Section 18.3, "Managing the Cluster Topology Diagram".
-
To view the properties for a given group, click on the group in the Group List.
-
To view the properties for a given server instance, click on the server instance in the Group List.
18.2.2 How to Monitor Nodes in an Oracle Coherence Cluster
Using Oracle CEP Visualizer, you can compare a combination of properties for any and all nodes in an Oracle Coherence cluster. For a selected node in an Oracle Coherence cluster, you can view a select list of properties.
Once you have determined the root cause of a problem, you can tune Oracle Coherence parameters to correct the problem. For more information, see Section 18.2.4, "How to Tune Oracle Coherence".
To monitor nodes in an Oracle Coherence cluster:
-
In the left pane, click the Domain node, where Domain refers to the name of your Oracle CEP domain.
-
In the right pane, click the Coherence tab.
-
In the right pane, click the Multi-Nodes Monitor tab.
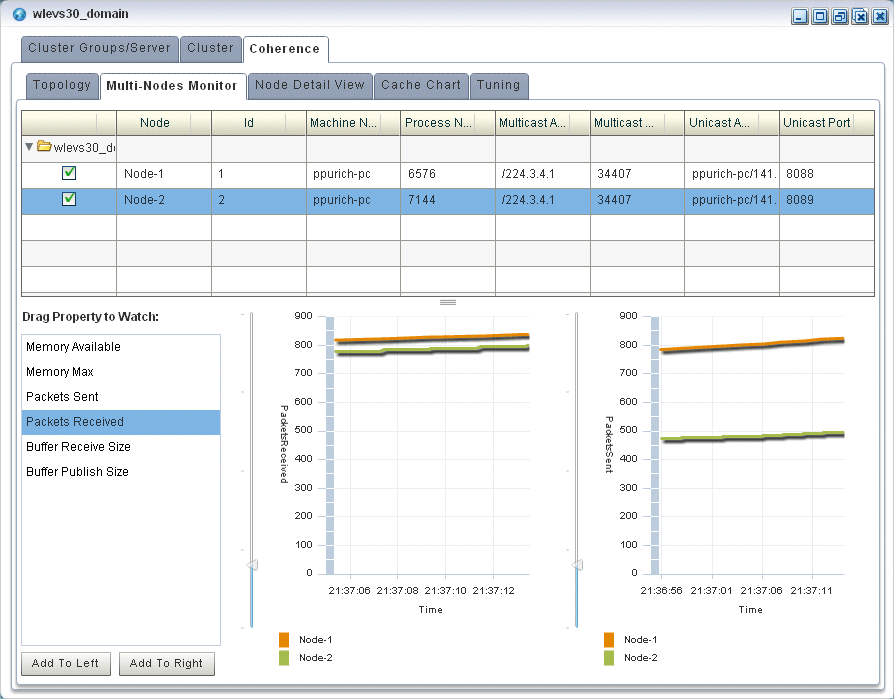
The Multi-Nodes Monitor tab appears as Figure 18-1 shows.
-
Use the Multi-Nodes Monitor tab to customize the group table:
-
To change the order of columns, click on the column name in the cache chart and drag left or right.
-
To change the sort order of a column, click the triangle to the right of the column name in the cache chart.
-
-
Use the Multi-Nodes Monitor tab to compare any combination of the properties that Table 18-1 lists for any nodes in an Oracle Coherence cluster:
-
Expand a group and check one or more nodes.
-
Drag a property from the Drag Property to Watch area to either graph to watch that property or, select a property and click Add to Left or Add to Right.
You may specify at most one property per graph.
-
A line is drawn for each selected node. The legend below the graph distinguishes graph data for each selected node by color.
-
To watch a different property, drag a new property and drop it onto the graph or, select a new property and click Add to Left or Add to Right.
-
To change the scale of a graph, drag the slider next to the vertical axis.
Table 18-1 Properties You Can Watch on the Multi-Nodes Monitor Tab
Property Description Memory AvailableThe total amount of free memory (in MB) for the selected node.
Memory MaxThe total amount of memory available (in MB) for the selected node.
Packets SentThe total number of Oracle Coherence packets sent by the selected node.
Packets ReceivedThe total number of Oracle Coherence packets received by the selected node.
Buffer Receive SizeThe total number of Oracle Coherence received packets that the selected node can buffer.
Buffer Publish SizeThe total number of Oracle Coherence published packets that the selected node can buffer.
-
-
To view more details for a particular node, click the Node Detail View tab.
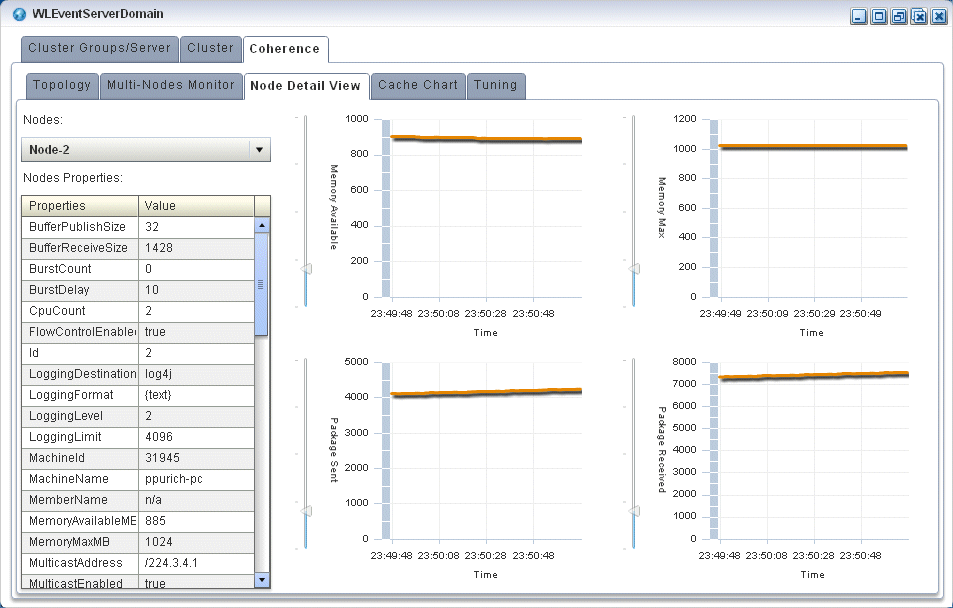
The Node Detail View tab appears as Figure 18-12 shows.
-
Use the Node Detail View tab to compare the properties that Table 18-2 lists for a selected node:
-
Select a node from the Nodes pull-down menu.
The properties for the selected node are shown in the Nodes Properties list.
-
A line is drawn for the selected node.
-
To change the scale of a graph, drag the slider next to the vertical axis.
Table 18-2 Properties You Can Watch on the Node Detail View Tab
Property Description Memory AvailableThe total amount of free memory (in MB) for the selected node.
Memory MaxThe total amount of memory available (in MB) for the selected node.
Packets SentThe total number of Oracle Coherence packets sent by the selected node.
Packets ReceivedThe total number of Oracle Coherence packets received by the selected node.
-
18.2.3 How to Monitor an Oracle Coherence Cache
Using Oracle CEP Visualizer, you can monitor a wide variety of Oracle Coherence cache parameters and graphically compare parameter values to locate and diagnose performance and operational problems.
Once you have determined the root cause of a problem, you can tune Oracle Coherence parameters to correct the problem. For more information, see Section 18.2.4, "How to Tune Oracle Coherence".
To monitor an Oracle Coherence Cache:
-
In the left pane, click the Domain node, where Domain refers to the name of your Oracle CEP domain.
-
In the right pane, click the Coherence tab.
-
In the right pane, click the Cache Chart tab.
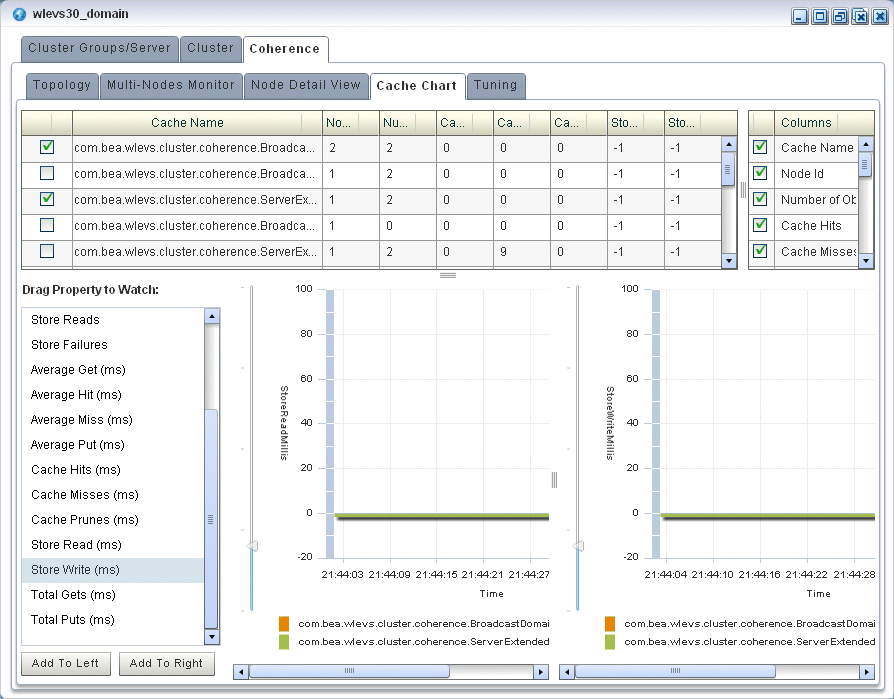
The Multi-Nodes Monitor tab appears as Figure 18-1 shows.
-
Use the Cache Chart tab to view any combination of the columns that Table 18-3 lists for one or more selected caches:
-
Check one or more caches in the cache chart.
-
To add a column to the cache chart, check the column in the Columns list.
-
To remove a column from the cache chart, uncheck the column in the Columns list.
-
To change the order of columns, click on the column name in the cache chart and drag left or right.
-
To change the sort order of a column, click the triangle to the right of the column name in the cache chart.
Table 18-3 Columns and Properties for the Cache Chart Tab
Property Description Cache NameThe name of the cache.
# of ObjectsThe total number of objects in the selected cache.
Cache HitsThe total number times an Oracle Coherence cache client has accessed the selected cache.
Cache MissesThe total number times an Oracle Coherence cache client has accessed the selected cache and failed to find the desired object.
Cache PrunesThe total number times Oracle Coherence has reached its maximum size and had to delete some objects to return to a configured smaller size for the selected cache.
Store WritesThe total number of times Oracle Coherence has written to the selected cache's backing store.
Store ReadsThe total number of times Oracle Coherence has read from the selected cache's backing store.
Node IdThe node identifier for the selected cache.
Store FailuresThe total number of times the selected cache's backing store has failed to service an Oracle Coherence Store Write or Store Read.
Average Hit MillisThe average time (in milliseconds) taken by Oracle Coherence to find an object in the selected cache.
Average Get MillisThe average time (in milliseconds) taken by Oracle Coherence to retrieve an object from the selected cache.
Average Miss MillisThe average time (in milliseconds) taken by Oracle Coherence to determine that an object does not exist in the selected cache.
Average Put MillisThe average time (in milliseconds) taken by Oracle Coherence to add a new object to the selected cache.
Cache Hits MillisThe total time (in milliseconds) taken by Oracle Coherence to find an object in the selected cache.
Cache Misses MillisThe total time (in milliseconds) taken by Oracle Coherence to determine that an object does not exist in the selected cache.
Cache Prunes MillisThe total time (in milliseconds) taken by Oracle Coherence to delete some objects from the selected cache to return to a configured smaller size after having reached its maximum size.
Store Read MillisThe total time (in milliseconds) taken by Oracle Coherence to read from the selected cache's backing store.
Store Write MillisThe total time (in milliseconds) taken by Oracle Coherence to write to the selected cache's backing store.
Total Gets MillisThe total time (in milliseconds) taken by Oracle Coherence to retrieve objects from the selected cache.
Total Puts MillisThe total time (in milliseconds) taken by Oracle Coherence to add new objects to the selected cache.
-
-
Use the Cache Chart tab to compare any combination of the properties that Table 18-3 lists for one or more selected caches:
-
Check one or more caches in the cache chart.
-
Drag a property from the Drag Property to Watch area to either graph to watch that property or, select the property and click Add to Left or Add to Right.
You may specify at most one property per graph.
-
A line is drawn for each selected cache. The legend below the graph distinguishes graph data for each selected cache by color.
-
To watch a different property, drag the new property and drop it onto the graph or, select a different property and click Add to Left or Add to Right.
-
To change the scale of a graph, drag the slider next to the vertical axis.
-
18.2.4 How to Tune Oracle Coherence
Using Oracle CEP Visualizer, you can view and modify a variety of Oracle Coherence parameters to fine tune Oracle Coherence performance.
Note:
Not all Oracle Coherence parameters can be modified. For more information, refer to your Oracle Coherence documentation.To determine the root cause of a problem, you can monitor Oracle Coherence parameters. For more information, see:
-
In the left pane, click the Domain node, where Domain refers to the name of your Oracle CEP domain.
-
In the right pane, click the Coherence tab.
-
In the right pane, click the Tuning tab.
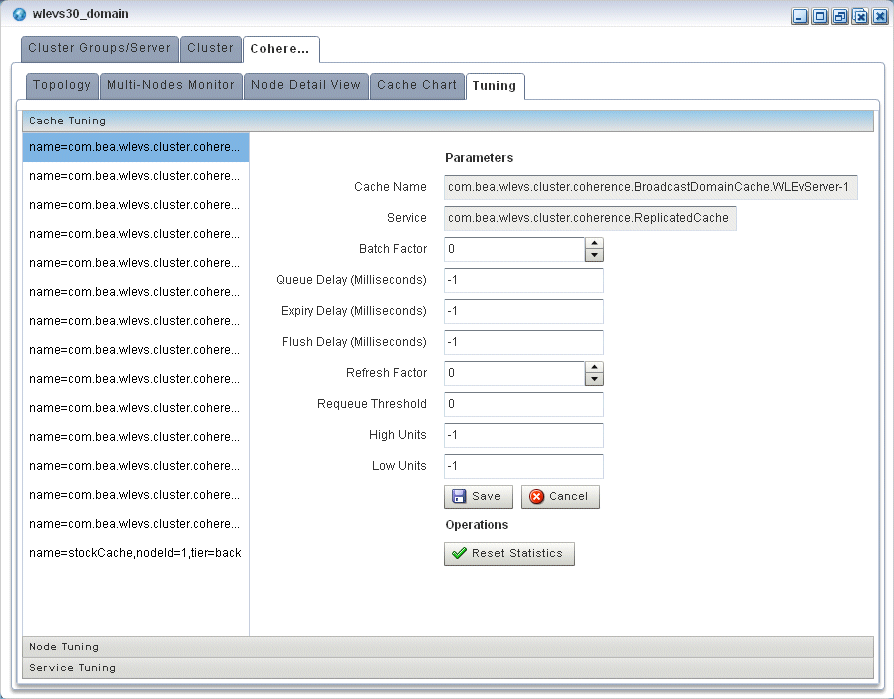
The Tuning tab appears as Figure 18-14 shows.
-
To tune parameters and invoke operations for caches, select the Cache Tuning accordion tab and select a cache as Figure 18-14 shows.
Table 18-4 lists the properties you can view and tune for the selected cache. All properties are based on Oracle Coherence
http://download.oracle.com/otn_hosted_doc/coherence/340/com/tangosol/net/management/Registry.html.Table 18-4 Cache Tuning: Properties
Property Description Cache NameThe name of the selected cache (read-only).
ServiceThe service associated with this cache (read-only).
Batch FactorThe
BatchFactorattribute is used to calculate the `soft-ripe` time for write-behind queue entries. A queue entry is considered to be `ripe` for a write operation if it has been in the write-behind queue for no less than theQueueDelayinterval. The `soft-ripe` time is the point in time prior to the actual `ripe` time after which an entry will be included in a batched asynchronous write operation to theCacheStore(along with all other `ripe` and `soft-ripe` entries). This attribute is only applicable if asynchronous writes are enabled (that is, the value of theQueueDelayattribute is greater than zero) and theCacheStoreimplements thestoreAll()method. The value of the element is expressed as a percentage of theQueueDelayinterval.Valid values are doubles in the interval [0.0, 1.0]..
Queue Delay (Milliseconds)The number of seconds that an entry added to a write-behind queue will sit in the queue before being stored via a
CacheStore. Applicable only forWRITE-BEHINDpersistence type.Expiry Delay (Milliseconds)The number of milliseconds that the MBeanServer will keep a remote model snapshot before refreshing.
Flush Delay (Milliseconds)The number of milliseconds between cache flushes. Value of zero indicates that the cache will never flush.
Refresh FactorThe
RefreshFactorattribute is used to calculate the `soft-expiration` time for cache entries. Soft-expiration is the point in time prior to the actual expiration after which any access request for an entry will schedule an asynchronous load request for the entry. This attribute is only applicable for aReadWriteBackingMapwhich has an internalLocalCachewith scheduled automatic expiration. The value of this element is expressed as a percentage of the internalLocalCacheexpiration interval.Valid values are doubles in the interval[0.0, 1.0]. If zero, refresh-ahead scheduling will be disabled.
Requeue ThresholdThe maximum size of the write-behind queue for which failed
CacheStorewrite operations are requeued. If zero, the write-behind requeueing will be disabled. Applicable only forWRITE-BEHINDpersistence type.High UnitsThe limit of the cache size measured in units. The cache will prune itself automatically once it reaches its maximum unit level. This is often referred to as the `high water mark` of the cache.
Low UnitsThe number of units to which the cache will shrink when it prunes. This is often referred to as a `low water mark` of the cache.
To apply changes, click the Save button.
To discard changes, click the Cancel button.
Table 18-5 lists the operations you can invoke for the selected cache.
-
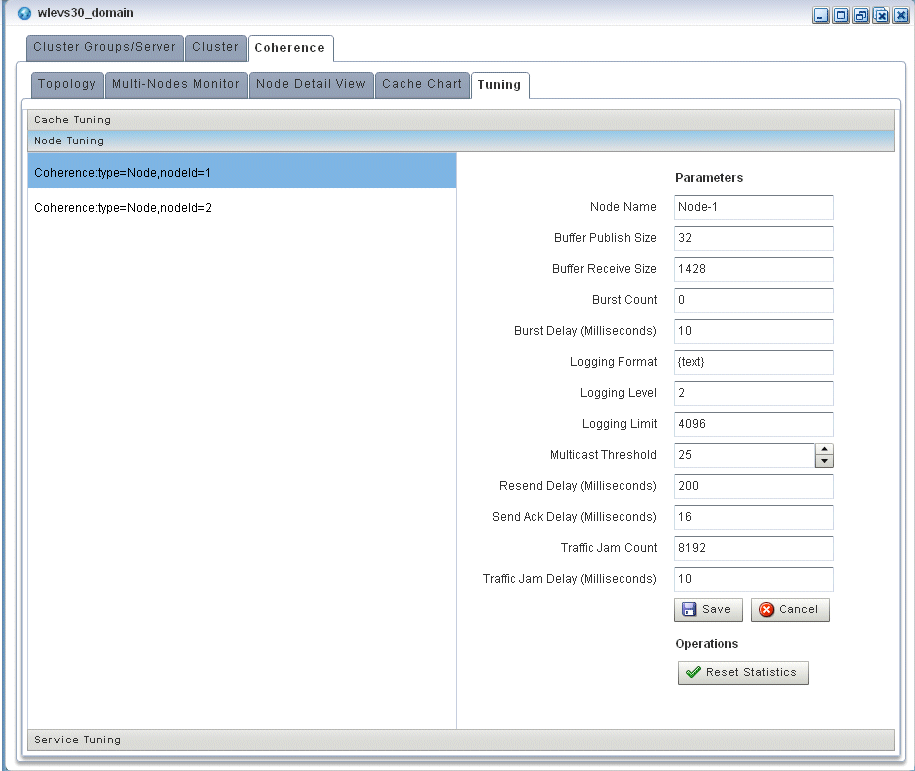
To tune parameters and invoke operations for cluster nodes, select the Node Tuning accordion tab and select a node as Figure 18-15 shows.
Table 18-4 lists the properties you can view and tune for the selected cache. All properties are based on Oracle Coherence
http://download.oracle.com/otn_hosted_doc/coherence/340/com/tangosol/net/management/Registry.html.Table 18-6 Node Tuning: Properties
Property Description Node NameThe name of the selected node (read-only).
Buffer Publish SizeThe buffer size of the unicast datagram socket used by the Publisher, measured in the number of packets.
Changing this value at runtime is an inherently unsafe operation that will pause all network communications and may result in the termination of all cluster services.
Buffer Receive SizeThe buffer size of the unicast datagram socket used by the Receiver, measured in the number of packets.
Changing this value at runtime is an inherently unsafe operation that will pause all network communications and may result in the termination of all cluster services.
Burst CountThe maximum number of packets to send without pausing. Anything less than one (for example, zero) means no limit.
Burst Delay (Milliseconds)The number of milliseconds to pause between bursts. Anything less than one (for example, zero) is treated as one millisecond.
Logging LevelSpecifies which logged messages will be output to the log destination.
Valid values are:
-
0 only output without a logging severity level specified will be logged
-
1 all the above plus errors
-
2 all the above plus warnings
-
3 all the above plus informational messages
-
4..9 all the above plus internal debugging messages (the higher the number, the more the messages)
-
-1 no messages
Logging FormatSpecifies how messages will be formatted before being passed to the log destination.
The value of the message-format element is static text with the following replaceable parameters:
-
{date}the date/time format (to a millisecond) at which the message was logged -
{version}the Oracle Coherence exact version and build details -
{level}the logging severity level of the message -
{thread}the thread name that logged the message -
{member}the cluster member id (if the cluster is currently running) -
{text}the text of the message
Logging LimitThe maximum number of characters that the logger daemon will process from the message queue before discarding all remaining messages in the queue. Valid values are integers in the range [0...]. Zero implies no limit.
Multicast ThresholdThe percentage (0 to 100) of the servers in the cluster that a packet will be sent to, above which the packet will be multicasted and below which it will be unicasted.
Resend Delay (Milliseconds)The minimum number of milliseconds that a packet will remain queued in the Publisher`s re-send queue before it is resent to the recipient(s) if the packet has not been acknowledged. Setting this value too low can overflow the network with unnecessary repetitions. Setting the value too high can increase the overall latency by delaying the re-sends of dropped packets. Additionally, change of this value may need to be accompanied by a change in
SendAckDelayvalue.Send Ack Delay (Milliseconds)The minimum number of milliseconds between the queueing of an Ack packet and the sending of the same. This value should be not more then a half of the
ResendDelayvalue.Traffic Jam CountThe maximum total number of packets in the send and resend queues that forces the publisher to pause client threads. Zero means no limit.
Traffic Jam Delay (Milliseconds)The number of milliseconds to pause client threads when a traffic jam condition has been reached. Anything less than one (for example, zero) is treated as one millisecond.
To apply changes, click the Save button.
To discard changes, click the Cancel button.
Table 18-5 lists the operations you can invoke for the selected node.
-
-
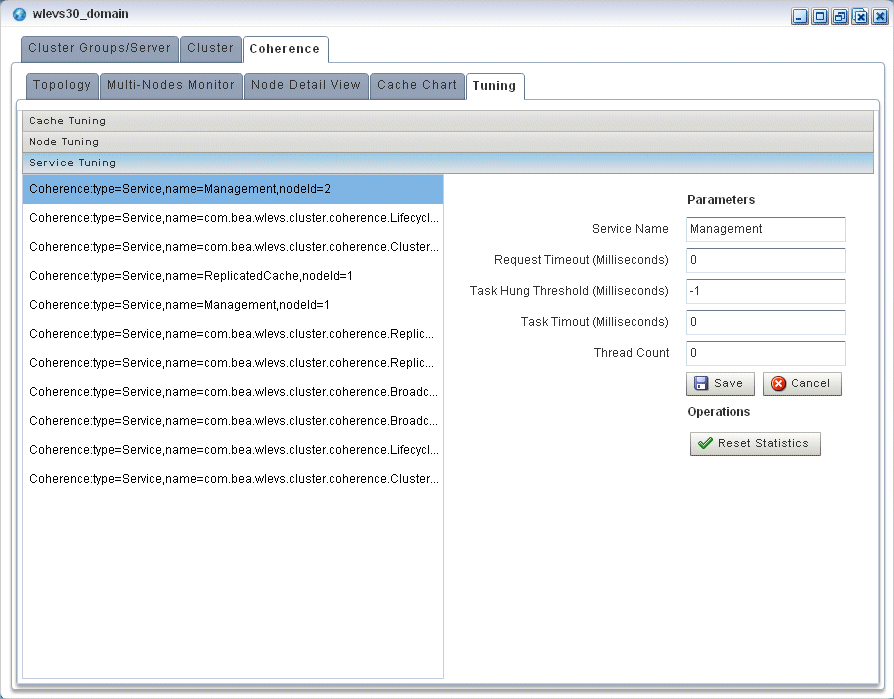
To tune parameters and invoke operations for nodes, select the Node Tuning accordion tab and select a node as Figure 18-15 shows.
Table 18-4 the properties you can view and tune for the selected cache. All properties are based on Oracle Coherence
http://download.oracle.com/otn_hosted_doc/coherence/340/com/tangosol/net/management/Registry.html.Table 18-8 Service Tuning: Properties
Property Description Service NameThe name of the selected service (read-only).
Request Timeout (Millis)The default timeout value in milliseconds for requests that can be timed-out (for example, implement the
com.tangosol.net.PriorityTaskinterface), but do not explicitly specify the request timeout value.Task Hung Threshold (Millis)The amount of time in milliseconds that a task can execute before it is considered hung. Note that a posted task that has not yet started is never considered as hung.
Task Timeout (Millis)The default timeout value in milliseconds for tasks that can be timed-out (for example, implement the
com.tangosol.net.PriorityTaskinterface), but do not explicitly specify the task execution timeout value.Thread CountThe number of threads in the service thread pool.
To apply changes, click the Save button.
To discard changes, click the Cancel button.
Table 18-5 lists the operations you can invoke for the selected service.
18.3 Managing the Cluster Topology Diagram
This section describes the various tools along the top of the Topology canvas as Figure 18-17 shows.
You use these tools to manage the topology diagram of your cluster topology.
18.3.1 Choose Layout
Use the Choose Layout pull-down menu to select alternate ways of distributing cluster groups. You can choose any of:
-
top-down
-
organic
-
hierarchic
-
orthogonal
18.3.2 Show All Groups
Check the Show All Groups option to show all the cluster topology groups listed on the Cluster Groups/Server tab including the AllDomainMembers group and the per-server groups.
This option is unchecked by default to reduce clutter on the Cluster Topology tab and to allow you to focus on the most important groups.
18.3.3 Zoom
Use the Zoom slider to increase or decrease the zoom level. This is an alternative to using the Zoom In and Zoom Out buttons (see Section 18.3.5, "Zoom In and Zoom Out").
18.3.4 Fit Content
Click the Fit Content button to adjust the zoom level automatically to make all of the diagram visible in the current browser window.
18.3.5 Zoom In and Zoom Out
Click the Zoom In and Zoom Out buttons to change the zoom level. This is an alternative to using the Zoom slider (see Section 18.3.3, "Zoom").
