3.4 Part 4: Building Matrix Reports
This part of the manual explains how you can build various kinds of matrix reports.
3.4.1 Building a matrix report
A matrix report looks like a grid. As shown in the sample output below, it contains one row of labels, one column of labels, and information in a grid format that is related to both the row and column labels. (Matrix reports are also sometimes referred to as "crosstab" reports.)
In this example, you will build a matrix report that contains three additions to the basic matrix: summaries have been added, zeroes replace non-existent values in the cells, and the cells themselves are surrounded by grid lines. Of the summaries, one sums the salaries by department, one sums them by job, and one sums them for the whole report.
Figure 3-23 Final output of the matrix report example

Description of "Figure 3-23 Final output of the matrix report example"
For more information on building this example, refer to Chapter 25, "Building a Matrix Report".
3.4.2 Building a nested matrix report
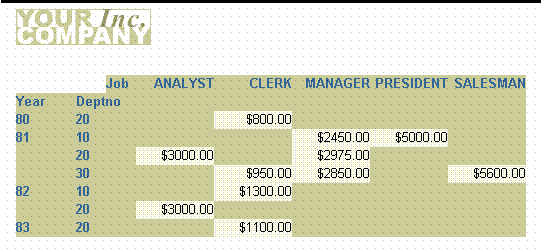
In this example, you will build the nested matrix report shown below. The cross product is capable of displaying every possible value for three dimensions: two down (YEAR and DEPTNO) and one across (JOB). This method does not include rows that have null values.
Figure 3-24 Final output of the nested matrix report example

Description of "Figure 3-24 Final output of the nested matrix report example"
For more information on building this example, refer to Chapter 26, "Building a Nested Matrix Report".
3.4.3 Building a matrix with group above report
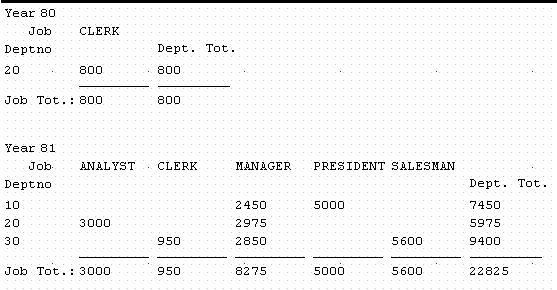
In this example, you will build a report that shows department, job, and salary information for each employee by the year they were hired using a matrix break format.
Figure 3-25 Final output of the matrix with group above report example

Description of "Figure 3-25 Final output of the matrix with group above report example"
For more information on building this example, refer to Chapter 27, "Building a Matrix with Group Above Report".